TensorBoard Tutorial: TensorFlow Visualization Tool
Machine Learning courses with 100+ Real-time projects Start Now!!
Today, in this article “TensorBoard Tutorial: TensorFlow Visualization Tool”, we will be looking at the term TensorBoard and will get a clear understanding about what is TensorBoard, Set-up for TensorBoard, Serialization in TensorBoard.
Moreover, we will discuss the launching of TensorBoard. At last, in this TensorBoard tutorial, we will study different types of Dashboards in TensorBoard.
So, let’s begin TensorBoard Tutorial.
What is TensorBoard?
Your work may involve some computations, with deep neural networks and other networks which contain complex calculations and a myriad of possible outcomes.
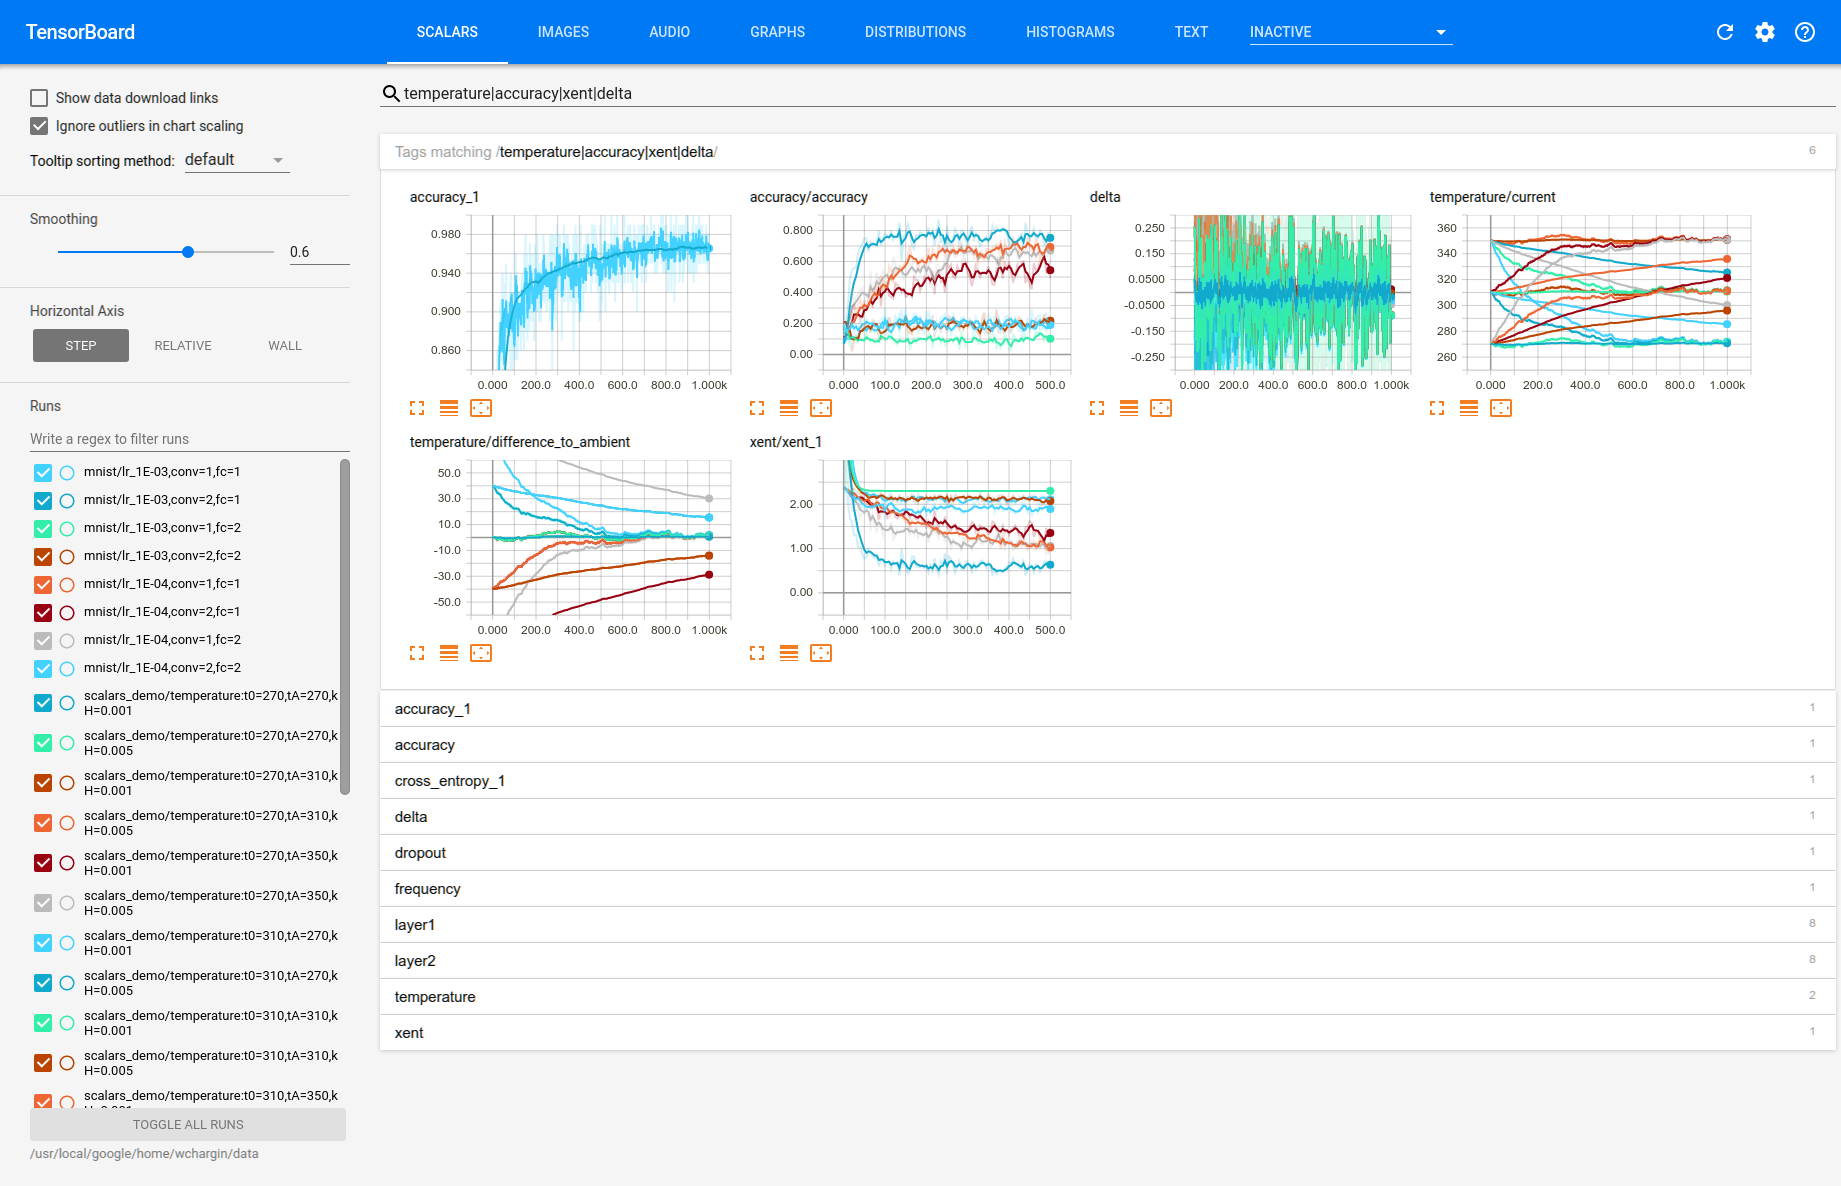
Therefore, TensorFlow offers a suite of visualization tools called TensorBoard with which you can visualize your TensorFlow graph, plot variables about the execution, and show additional data like images that pass through it. TensorBoard looks like this:
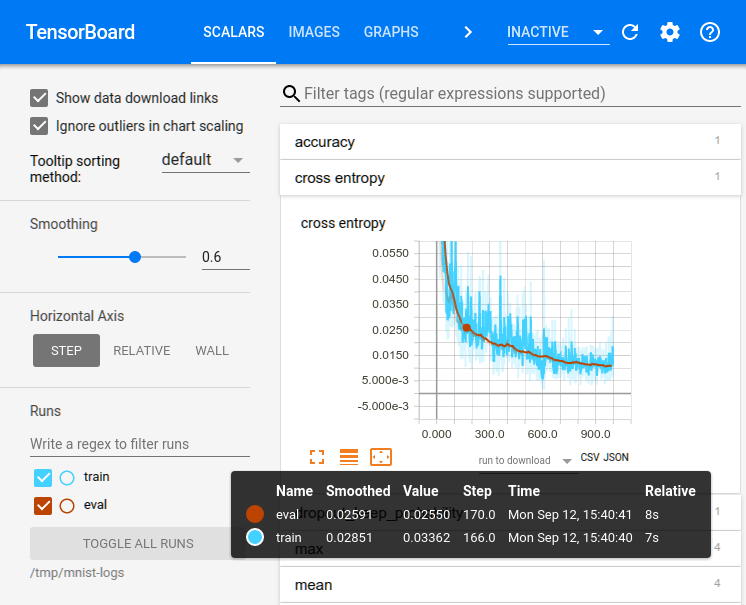
TensorBoard Tutorial – What is TensorBoard
TensorBoard Tutorial – Set-up
Now, to start off, install Tensorflow. It is suggested to install via pip as it should also automatically install TensorBoard.
Serialization in TensorBoard
TensorFlow events files are read by this visualization tool i.e. by TensorBoard, which contains summary data that you can generate when running TensorFlow. The lifecycle of a data within the TensorBoard is described as follows:
Now, suppose you have an MNIST database and are using a convolutional neural network for recognizing the digits. You can look at how the learning rate varies over time and the updating of parameter values with the help of TensorBoard.
Attach tf.summary.scalar operations to the nodes that output the learning rate and loss. Then, you can make it easier by giving the scalar_summary a tag, like ‘learning rate’ or ‘loss function’.
Until you run the ops, they won’t do anything and is reflected on an op that depends on their output. The summary nodes just created are an addition to your TensorFlow graph. Not any of the ops you are currently running, depend on them.
Therefore, you can run all of them altogether and you can use tf.summary.merge_all to merge all of it into a single operation that generates all the summary data.
Then, you can just run the merged summary operation, and it will generate an object called the prototype buffer with all the board summary data at a given step. To save this summary result to your disk drive, you should use tf.summary.FileWriter.
a. File Writer in TensorBoard
File Writer may sometimes input a TensorFlow graph in the constructor & if an object is passed along with it, then TensorBoard will visualize the TensorFlow graph along with the shape statistics.
Run the code, then launch TensorBoard –logdir=/tmp/tensorflow/mnist, you’ll wind up with stats that will tell you how the weights and accuracy varied during the course of the training.
def variable_summaries(var):
   with tf.name_scope('summaries'):
    mean = tf.reduce_mean(var)
    tf.summary.scalar('mean', mean)
    with tf.name_scope('stddev'):
      stddev = tf.sqrt(tf.reduce_mean(tf.square(var - mean)))
    tf.summary.scalar('stddev', stddev)
    tf.summary.scalar('max', tf.reduce_max(var))
    tf.summary.scalar('min', tf.reduce_min(var))
    tf.summary.histogram('histogram', var)
def nn_layer(input_tensor, input_dim, output_dim, layer_name, act=tf.nn.relu):
  with tf.name_scope(layer_name):
    # This Variable will hold the state of the weights for the layer
    with tf.name_scope('weights'):
      weights = weight_variable([input_dim, output_dim])
      variable_summaries(weights)
    with tf.name_scope('biases'):
      biases = bias_variable([output_dim])
      variable_summaries(biases)
    with tf.name_scope('Wx_plus_b'):
      preactivate = tf.matmul(input_tensor, weights) + biases
      tf.summary.histogram('pre_activations', preactivate)
    activations = act(preactivate, name='activation')
    tf.summary.histogram('activations', activations)
    return activations
hidden1 = nn_layer(x, 784, 500, 'layer1')
with tf.name_scope('dropout'):
  keep_prob = tf.placeholder(tf.float32)
  tf.summary.scalar('dropout_keep_probability', keep_prob)
  dropped = tf.nn.dropout(hidden1, keep_prob)
y = nn_layer(dropped, 500, 10, 'layer2', act=tf.identity)
with tf.name_scope('cross_entropy'):  with tf.name_scope('total'):
    cross_entropy = tf.losses.sparse_softmax_cross_entropy(labels=y_, logits=y)
tf.summary.scalar('cross_entropy', cross_entropy)
with tf.name_scope('train'):
  train_step = tf.train.AdamOptimizer(FLAGS.learning_rate).minimize(
      cross_entropy)
with tf.name_scope('accuracy'):
  with tf.name_scope('correct_prediction'):
    correct_prediction = tf.equal(tf.argmax(y, 1), tf.argmax(y_, 1))
  with tf.name_scope('accuracy'):
    accuracy = tf.reduce_mean(tf.cast(correct_prediction, tf.float32))
tf.summary.scalar('accuracy', accuracy)
merged = tf.summary.merge_all()
train_writer = tf.summary.FileWriter(FLAGS.summaries_dir + '/train',
                                      sess.graph)
test_writer = tf.summary.FileWriter(FLAGS.summaries_dir + '/test')
tf.global_variables_initializer().run()
Now, after initializing the File Writers, it’s a good habit to add summaries to the File Writers as you process through the model.
def feed_dict(train):
  """Make a TensorFlow feed_dict: maps data onto Tensor placeholders."""
  if train or FLAGS.fake_data:
    xs, ys = mnist.train.next_batch(100, fake_data=FLAGS.fake_data)
    k = FLAGS.dropout
  else:
    xs, ys = mnist.test.images, mnist.test.labels
    k = 1.0
  return {x: xs, y_: ys, keep_prob: k}
for i in range(FLAGS.max_steps):
  if i % 10 == 0:  # Record summaries and test-set accuracy
    summary, acc = sess.run([merged, accuracy], feed_dict=feed_dict(False))
    test_writer.add_summary(summary, i)
    print('Accuracy at step %s: %s' % (i, acc))
  else:  # Record train set summaries, and train
    summary, _ = sess.run([merged, train_step], feed_dict=feed_dict(True))
    train_writer.add_summary(summary, i)
Launching of TensorBoard
Now, to run TensorBoard, use the following command.
tensorboard --logdir=path/to/log-directory
Now, for Python, you can use,
python -m tensorboard.main
Where logdir points to the directory where the File Writer arranged its data. The logdir directory may contain subdirectories which contain serialized data from individual iterations. After starting the board, go to localhost:6006 to view the TensorBoard.
There are navigation tabs in the top right corner. Each tab is a set of data that can be visualized.
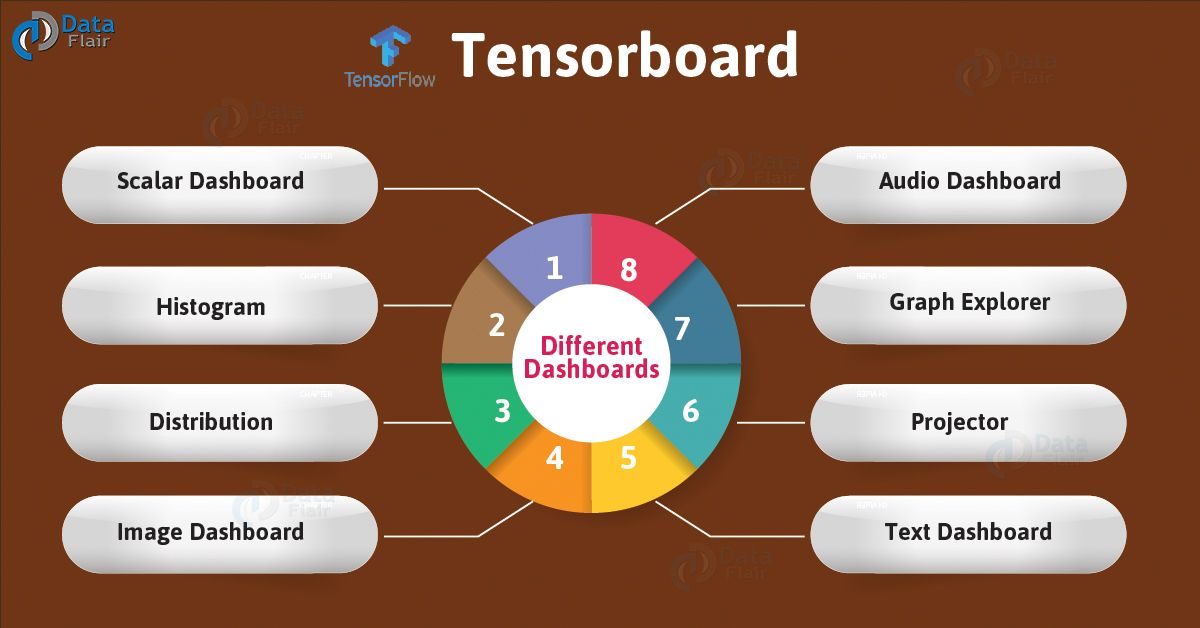
Different Dashboards in TensorBoard
Now, in this TensorBoard tutorial, let’s discuss the different types of Dashboards in TensorBoard in detail:
TensorBoard Tutorial- Different types of Dashboards
a. Scalar Dashboard
Used to visualize time-dependent stats; for example, you might want to look at the variations in learning rate or the loss function.
TensorBoard Tutorial- 8 types of Dashboards
b. Histogram
Histogram Dashboard in TensorBoard displays how the statistical distribution of a Tensor has varied over time. It visualizes data recorded via tf.summary.histogram. Individual “slices” of data is shown by every chart, and each slice represents a histogram at a given step.
Also, by changing the Histogram Mode from “offset” to “overlay”, rotate is enable, so that every histogram slice is processed as a line and overlapped with one another.
c. Distribution Dashboard
Here in this TensorBoard dashboard, you use tf.summary.histogram. It shows some high-level stats on a distribution. Each line on the chart gives a hint about the percentile in the distribution over the data.
Learn about TensorFlow Image Recognition
d. Image Dashboard
This shows the png(s) that were saved via a tf.summary.image. Here, rows correspond to the labels and the columns to the run. By using this Image dashboard of TensorBoard, you can embed custom visualizations.
e. Audio Dashboard
Great tool for embedding playable audio widgets for audios saved via a tf.summary.audio. Here, again, the rows represent the tags whereas the columns represent the run. This dashboard always embeds the latest audio for each tag.
f. Graph Explorer
Primarily used for enabling inspection of the TensorFlow model.
g. Projector
Basically, the embedding Projector in TensorBoard used for multi-dimensional data. The embedding projector reads data from the checkpoint file and might be set up with complementary data, such as a vocabulary file.
h. Text Dashboard
Text Dashboard shows text excerpts saved via tf.summary.text., includes features like hyperlinks, lists, and tables are all supported.
So, this was all in TensorBoard Tutorial. Hope you like our explanation.
Conclusion: TensorBoard Tutorial
Hence, in this TensorBoard tutorial, we saw the meaning of TensorBoard, its set up and also the serialization in TensorBoard. Moreover, we discussed TensorBoard launching and various dashboard in TensorBoard.
Therefore, after viewing the TensorBoard tutorial we can conclude that without TensorBoard, TensorFlow is incomplete. Furthermore, for any query, feel free to ask in the comment section.
You give me 15 seconds I promise you best tutorials
Please share your happy experience on Google


Thank you for your post. This is excellent information. It is amazing and wonderful to visit your site.