TensorFlow Debugging – Commands and Training
Machine Learning courses with 100+ Real-time projects Start Now!!
In our last article, we saw Embedding in TensorFlow. Today we’ll be learning Debugging in Tensorflow using different methods offered by the machine learning library. Moreover, we will see a brief of TensorFlow Debugging and how to wrap TensorFlow sessions.
So, let’s start TensorFlow Debugging.
TensorFlow Debugging
Tenosrflow has its own debugger called the tfdbg TensorFlow Debugging, which lets you observe the intrinsic working and the state of the running graphs. These are difficult to debug with any other general debuggers like pdb in python.
This tutorial will deal with the command line interface for TensorFlow debugging. There is also a Tensorflow debugging plugin available for users to exploit.
This tutorial will teach you how to use the tfdbg CLI to debug the appearance of nans and infs, which are the most common type of bugs found in tensorflow. Given below is a low-level API example:
python -m tensorflow.python.debug.examples.debug_mnist
The code given above will train a neural network for MNIST digit image recognition and the accuracy increases slightly before saturating after a number of steps.
This error may be due to the infs and nans, which are the most common bugs. Now, let’s use tfdbg to debug the issue and know where exactly the problem began.
Wrapping TensorFlow Sessions With tfdbg
Add the following lines of code to use tfdbg and then contain the Session object using a debugger wrapper.
from tensorflow.python import debug as tf_debug
sess = tf_debug.LocalCLIDebugWrapperSession(sess)
This wrapper offers some added features, which include:
CLI should be called before and after Session.run() if you wish to take control of the execution and know the internal state of the graph.
Filters can be added for assisting the diagnosis and in the provided example, there is already a filter called tfdbg.has_inf_or_nan, which determine the presence of nan or inf in any in-between tensors, which are neither inputs nor outputs.
You are always free to write your own code for custom filters that suit your needs and you can look at the API documentation for additional information for the same.
Debugging TensorFlow Model Training with tfdbg
Now, it’s time to train the model with including the –debug flag:
python -m tensorflow.python.debug.examples.debug_mnist –debug
The fetched data will be displayed on the screen and will look something like the image shown below:
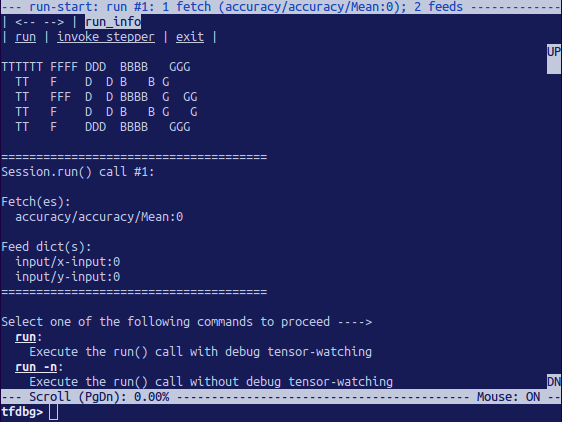
Debugging TensorFlow Model Training with tfdbg
The above picture is the run-start interface. After this, enter the run or r at the prompt:
tfdbg> run
This will make the Tensorflow debugger run till the next session call, calculating the accuracy for the test dataset. The debugger will display the ditched tensors in the run-end interface. For example:
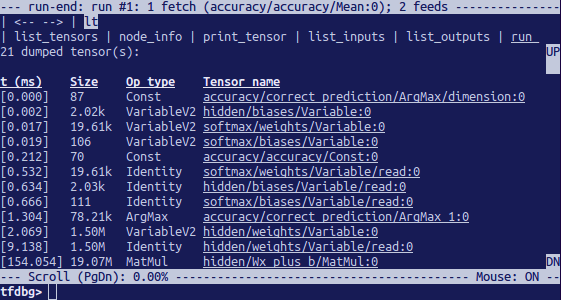
ditched tensors in the run-end interface
You can list the tensors using lt command after you’ve executed run.
Frequently-Used TensorFlow Debugging Commands
Attempt the following commands at the tfdbg> prompt (referencing the code at tensorflow/python/debug/examples/debug_mnist.Py):
Note that whenever you enter a command, a brand new display output will seem. That is incredibly analogous to internet pages in a browser. You may navigate between those screens through clicking the <– and –> text arrows close to the top-left corner of the CLI.
Features of tfdbg CLI
Similarly to the TensorFlow Debugging commands indexed above, the tfdbg CLI gives the subsequent additional capabilities:
To navigate thru preceding tfdbg instructions, type in some characters accompanied by the Up or Down arrow keys. Tfdbg will show you the history of instructions that commenced with the ones characters.
To navigate thru the records of screen outputs, do both of the following:
Use the prev and next commands.
Click underlined <– and –> hyperlinks close to the pinnacle left corner of the display screen.
Tab final touch of commands and some command arguments.
To redirect the display screen output to a record in preference to the screen, quit the command with bash-style redirection. For instance, the subsequent command redirects the output of the pt command to the
/tmp/xent_value_slices.txtfile:
tfdbg> pt cross_entropy/Log:0[:, 0:10] > /tmp/xent_value_slices.txt
Finding nans and infs
On this first consultation Run() call, there take place to be no intricate numerical values. You could move on to the following run by the usage of the command run or its shorthand r.
TIP: if you enter run or r repeatedly, you’ll be able to circulate thru the consultation.Run() calls in a sequential manner.
You can additionally use the -t flag to transport before and some of the session.Run() calls at a time, as an instance:
tfdbg> run -t 10
Rather than entering run repeatedly and manually searching for nans and infs inside the run-quit UI after every session.
Run() name (as an example, through the use of the pt command proven within the table above), you may use the following command to permit the debugger, again and again, execute consultation.
Run() calls without stopping at the run-start or run-stop activate, till the primary nan or inf value suggests up in the graph. That is analogous to conditional breakpoints in some procedural-language debuggers:
tfdbg> run -f has_inf_or_nan
Observe: The preceding command works nicely because a tensor clears out known as has_inf_or_nan has been registered for you when the wrapped consultation is created. This clear out detects nans and infs (as defined previously).
If you have registered some other filters, you could use “run -f” to have tfdbg run until any tensor triggers that filter (purpose the filter out to go back true).
def my_filter_callable(datum, tensor):
   return len(tensor.shape) == 0 and tensor == 0.0
sess.add_tensor_filter('my_filter', my_filter_callable)
Then at the tfdbg run-start prompt run until your filter is precipitated:
tfdbg> run -f my_filter
See this API document for more statistics at the expected signature and go back a value of the predicate Callable used with add_tensor_filter().
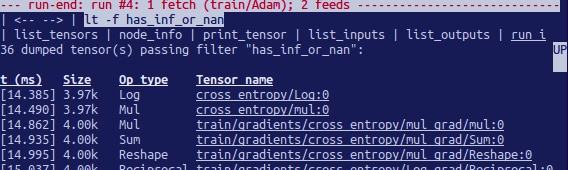
TensorFlow Debugging – Finding nans and infs
Because the display show suggests on the primary line, the has_inf_or_nan filter out is first brought about throughout the fourth consultation.Run() call: an Adam optimizer ahead-backward education skip at the graph. In this run, 36 (out of the full ninety-five) intermediate tensors incorporate nan or inf values.
These tensors are indexed in chronological order, with their timestamps displayed at the left. On the pinnacle of the listing, you can see the first tensor in which the horrific numerical values first surfaced: cross_entropy/Log:zero.
To view the price of the tensor, click the underlined tensor name cross_entropy/Log:0 or enter the equivalent command:
tfdbg> pt cross_entropy/Log:0
Scroll down a touch and you’ll word some scattered inf values. If the instances of inf and nan are hard to identify by eye, you may use the following command to perform a regex seek and spotlight the output:
tfdbg> /inf
Or, as a substitute:
tfdbg> /(inf|nan)
You can additionally use the -s or –numeric_summary command to get a brief summary of the sorts of numeric values within the tensor:
tfdbg> pt -s cross_entropy/Log:0
From the precis, you can see that several of the thousand elements of the cross_entropy/Log:zero tensor are -infs (negative infinities).
Why did those infinities appear? To further debug, show more information approximately the node cross_entropy/Log via clicking the underlined node_info menu item on the pinnacle or getting into the equivalent node_info (ni) command:
tfdbg> ni cross_entropy/Log
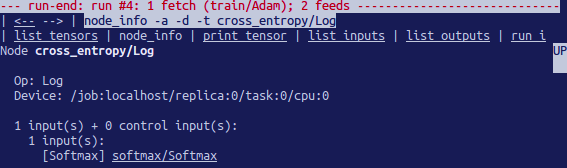
TensorFlow Debugging
You can see that this node has the op type log and that its input is the node Softmax. Run the subsequent command to take a more in-depth observe the input tensor:
tfdbg> pt Softmax:0
Have a look at the values in the enter tensor, looking for zeros:
tfdbg> /0\.000
Indeed, there are zeros. Now it is clean that the foundation of the terrible numerical values is the node cross_entropy/Log talking logs of zeros. To find out the wrongdoer line within the Python supply code, use the -t flag of the ni command to show the traceback of the node’s production:
tfdbg> ni -t cross_entropy/Log
In case you click “node_info” at the top of the display, tfdbg mechanically suggests the traceback of the node’s creation.
From the traceback, you can see that the op is built at the following line: debug_mnist.Py:
diff = y_ * tf.log(y)
Tfdbg has a feature that makes it easy to trace Tensors and ops again to lines in Python supply documents. It is able to annotate lines of a Python record with the ops or Tensors created with the aid of them.
To use this selection, without a doubt click the underlined line numbers in the stack trace output of the ni -t <op_name> instructions, or use the PlayStation (or print_source) command along with: ps /course/to/source.Py. As an instance, the subsequent screenshot indicates the output of a ps command.
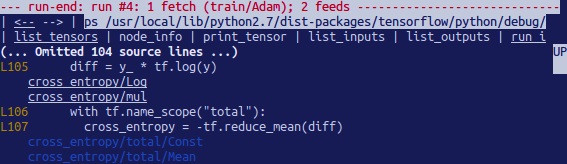
TensorFlow Debugging
Fixing Problem in TensorFlow Debugging
To restore the problem, edit debug_mnist.Py, changing the unique line:
diff = -(y_ * tf.log(y))
To the built-in, numerically-stable implementation of softmax move-entropy:
diff = tf.losses.sparse_softmax_cross_entropy(labels=y_, logits=logits)
Rerun with the –debug flag as follows:
python -m tensorflow.python.debug.examples.debug_mnist --debug
At the tfdbg> prompt, enter the following command:
run -f has_inf_or_nan
Affirm that no tensors are flagged as containing nan or inf values, and accuracy now maintains to rise as opposed to getting stuck. Success!
Debugging tf-learn Estimators and Experiments
This phase explains the way to debug TensorFlow packages that use the Estimator and test APIs. A part of the convenience supplied by way of these APIs is that they manage classes internally.
This makes the LocalCLIDebugWrapperSession defined in the preceding sections inapplicable. Luckily, you may nonetheless debug them by means of the usage of unique hooks provided via tfdbg.
Debugging tf.contrib.learn Estimators
Presently, tfdbg can debug the fit() evaluate() methods of tf-examine Estimators. To debug Estimator.Suit(), create a LocalCLIDebugHook and supply it in the video display units argument. As an example:
from tensorflow.python import debug as tf_debug
hooks = [tf_debug.LocalCLIDebugHook()]
classifier.fit(x=training_set.data,
               y=training_set.target,
               steps=1000,
               monitors=hooks)
To debug Estimator.Examine(), assign hooks to the hooks parameter, as inside the following instance:
accuracy_score = classifier.evaluate(x=test_set.data,
                                     y=test_set.target,
                                     hooks=hooks)["accuracy"]
Debug_tflearn_iris.Py, based on tf-research’s iris tutorial, contains a full example of the way to use the tfdbg with Estimators. To run this case, do:
python -m tensorflow.python.debug.examples.debug_tflearn_iris --debug
Debugging tf.contrib.learn Experiments
An experiment is an assembly in tf.Contrib.Examine at a better degree than Estimator. It gives a single interface for education and comparing a model.
To debug the teach() and evaluate() calls to an test object, you can use the keyword arguments train_monitors and eval_hooks, respectively, when calling its constructor. As an example:
from tensorflow.python import debug as tf_debug
hooks = [tf_debug.LocalCLIDebugHook()]
ex = experiment.Experiment(classifier,
                           train_input_fn=iris_input_fn,
                           eval_input_fn=iris_input_fn,
                           train_steps=FLAGS.train_steps,
                           eval_delay_secs=0,
                           eval_steps=1,
                           train_monitors=hooks,
                           eval_hooks=hooks)
ex.train()
accuracy_score = ex.evaluate()["accuracy"]
To build and run the debug_tflearn_iris example inside the experiment mode, do:
python -m tensorflow.python.debug.examples.debug_tflearn_iris \
    --use_experiment --debug
The LocalCLIDebugHook also allows you to configure a watch_fn that can be used to flexibly specify what Tensors to watch on one of a kind session.Run() calls, as a characteristic of the fetches and feed_dict and different states. See this API doc for more info.
Debugging Keras Models with TFDBG
To use TFDBG with Keras, allow the Keras backend use a TFDBG-wrapped consultation item. As an instance, to use the CLI wrapper:
import tensorflow as tf
from keras import backend as keras_backend
from tensorflow.python import debug as tf_debug
keras_backend.set_session(tf_debug.LocalCLIDebugWrapperSession(tf.Session()))
# Define your keras model, called "model".
model.fit(...)  # This will break into the TFDBG CLI.
Debugging tf-slim with TFDBG
TFDBG supports debugging of training and evaluation with tf-slim. As detailed below, training and evaluation require slightly different debugging workflows.
Debugging training in tf-slim
TFDBG supports TensorFlow debugging of training and evaluation with tf-slender. As particular below, training and evaluation require slightly special TensorFlow debugging workflows.
import tensorflow as tf
from tensorflow.python import debug as tf_debug
# ... Code that creates the graph and the train_op ...
tf.contrib.slim.learning.train(
    train_op,
    logdir,
    number_of_steps=10,
    session_wrapper=tf_debug.LocalCLIDebugWrapperSession)
Debugging evaluation in tf-slim
To debug the schooling system, offer LocalCLIDebugWrapperSession to the session_wrapper argument of slender.Mastering.Educate(). As an instance:
import tensorflow as tf
from tensorflow.python import debug as tf_debug
# ... Code that creates the graph and the eval and final ops ...
tf.contrib.slim.evaluation.evaluate_once(
    '',
    checkpoint_path,
    logdir,
    eval_op=my_eval_op,
    final_op=my_value_op,
    hooks=[tf_debug.LocalCLIDebugHook()])
Offline Debugging of Remotely-Running Sessions
Often, your version is going for walks on a faraway machine or a method that you do not have terminal access to. To perform version TensorFlow debugging in such instances, you may use the offline_analyzer binary of tfdbg (described under).
It operates on dumped facts directories. This could be done to both the lower-level session API and the better-degree Estimator and test APIs.
Debugging Remote tf.Sessions
In case you have interaction without delay with the tf.Session API in python, you can configure the RunOptions proto that you call your session.Run() technique with, via the usage of the approach tfdbg.Watch_graph.
Further, this will purpose the intermediate tensors and runtime graphs to be dumped to a shared storage location of your choice whilst the session.Run() name occurs (on the fee of slower overall performance). For instance:
from tensorflow.python import debug as tf_debug
# ... Code where your session and graph are set up...
run_options = tf.RunOptions()
tf_debug.watch_graph(
      run_options,
      session.graph,
      debug_urls=["file:///shared/storage/location/tfdbg_dumps_1"])
# Be sure to specify different directories for different run() calls.
session.run(fetches, feed_dict=feeds, options=run_options)
Later, in an surroundings that you have terminal access to (as an instance, a nearby laptop that can get admission to the shared garage location exact within the code above), you could load and inspect the records in the sell off directory at the shared storage by way of the use of the offline_analyzer binary of tfdbg.
As an example:
python -m tensorflow.python.debug.cli.offline_analyzer \
    --dump_dir=/shared/storage/location/tfdbg_dumps_1
The session wrapper DumpingDebugWrapperSession gives an easier and greater bendy manner to generate document-system dumps that may be analyzed offline. To apply it, actually wrap your consultation in a tf_debug.DumpingDebugWrapperSession. As an example:
from tensorflow.python import debug as tf_debug
sess = tf_debug.DumpingDebugWrapperSession(
    sess, "/shared/storage/location/tfdbg_dumps_1/", watch_fn=my_watch_fn)
The watch_fn argument accepts a Callable that permits you to configure what tensors to observe on distinct consultation.Run() calls, as a function of the fetches and feed_dict to the run() name and different states.
C++ and other languages
If your version code is written in C++ or other languages, you can additionally modify the debug_options subject of RunOptionsto generate debug dumps that can be inspected offline. See the proto definition for extra information.
Debugging Remotely-Running tf-learn Estimators and Experiments
If your far off TensorFlow server runs Estimators, you could use the non-interactive DumpingDebugHook. As an instance:
from tensorflow.python import debug as tf_debug
hooks = [tf_debug.DumpingDebugHook("/shared/storage/location/tfdbg_dumps_1")]Then this hook may be used in the same manner because the LocalCLIDebugHook examples described earlier on this file. As the education and/or evalution of Estimator or experiment takes place, tfdbg creates directories having the following call sample:
/shared/garage/place/tfdbg_dumps_1/run_<epoch_timestamp_microsec>_<uuid>. Each listing corresponds to a session.Run() name that underlies the suit() or compare() call.
You can load those directories and inspect them in a command-line interface in an offline way the usage of the offline_analyzer supplied by tfdbg. As an instance:
python -m tensorflow.python.debug.cli.offline_analyzer \
    --dump_dir="/shared/storage/location/tfdbg_dumps_1/run_<epoch_timestamp_microsec>_<uuid>"
So, this was all about TensorFlow Debugging. Hope you like our explanation.
Conclusion
Hence, in this TensorFlow Debugging tutorial, we saw how to debug your code using different methods, classes, and APIs as well as the meanings of these representations.
Moreover, we discussed different commands in TensorFlow Debugging. Next up is the tutorial on visualizing the graphs in tensorflow, aka, tensorboard. Still, if any doubt, feel free to ask in the comment tab.
We work very hard to provide you quality material
Could you take 15 seconds and share your happy experience on Google


