Pandas Datetime Functionality | How Timedeltas & Time Series Works
Get Job-Ready: Data Analysis using Python with 70+ Projects Start Now!!
You will come across time and date series when working with data regularly. Pandas have often proved to be very useful when working with such data. It provides you a number of tools which you can use to perform all necessary tasks on such data. This tutorial is specially designed to explore different types of operations performed with Pandas Datetime functionality.
By the end of this article, you will be skilled with Pandas timedelta, time series, a DateTimeIndex object in pandas and many more. So, don’t waste your time and grab the opportunity.
1. How to create Pandas datetime object?
To create pandas datetime object, we will start with importing pandas-
>>>import pandas as pd
This allows us to create an index set according to the time frame.
To create Pandas DateTime object we use the .date_range function. It has the following parameter:
- First parameter: start= ‘dd/mm/yyyy’.
- Second parameter: periods= n, where n is no of periods or date time elements you need.
- Third parameter: freq= ‘x’, where ‘x’ can be ‘H’(hour), ‘D’(days), ‘W’(weeks), ‘M’(month), ‘Y’(years), etc.
Before moving ahead, you should know the Basic Functionality of Pandas
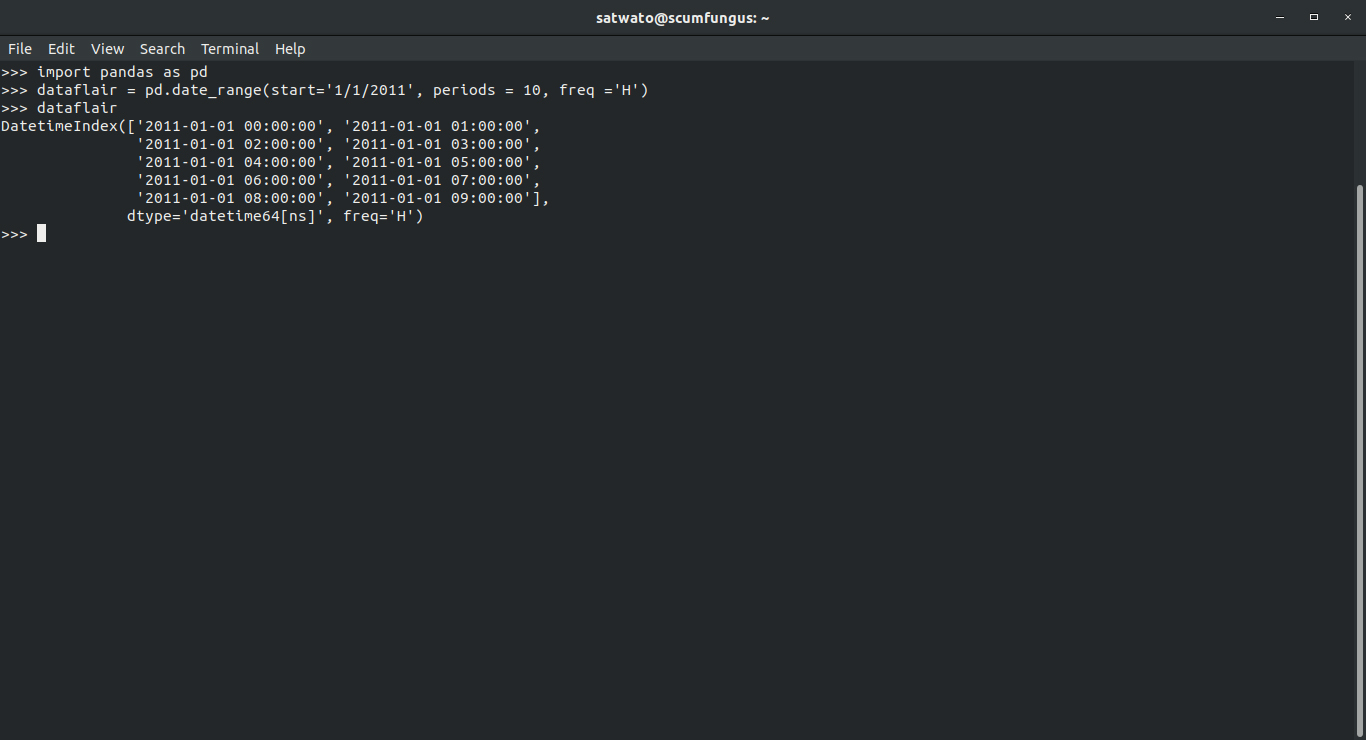
>>> dataflair = pd.date_range(start='1/1/2011', periods = 10, freq ='H')
>>> dataflair
Output-
DatetimeIndex([‘2011-01-01 00:00:00’, ‘2011-01-01 01:00:00’,
‘2011-01-01 02:00:00’, ‘2011-01-01 03:00:00’,
‘2011-01-01 04:00:00’, ‘2011-01-01 05:00:00’,
‘2011-01-01 06:00:00’, ‘2011-01-01 07:00:00’,
‘2011-01-01 08:00:00’, ‘2011-01-01 09:00:00′],
dtype=’datetime64[ns]’, freq=’H’)
How to print date in yyyy-mm-dd format?
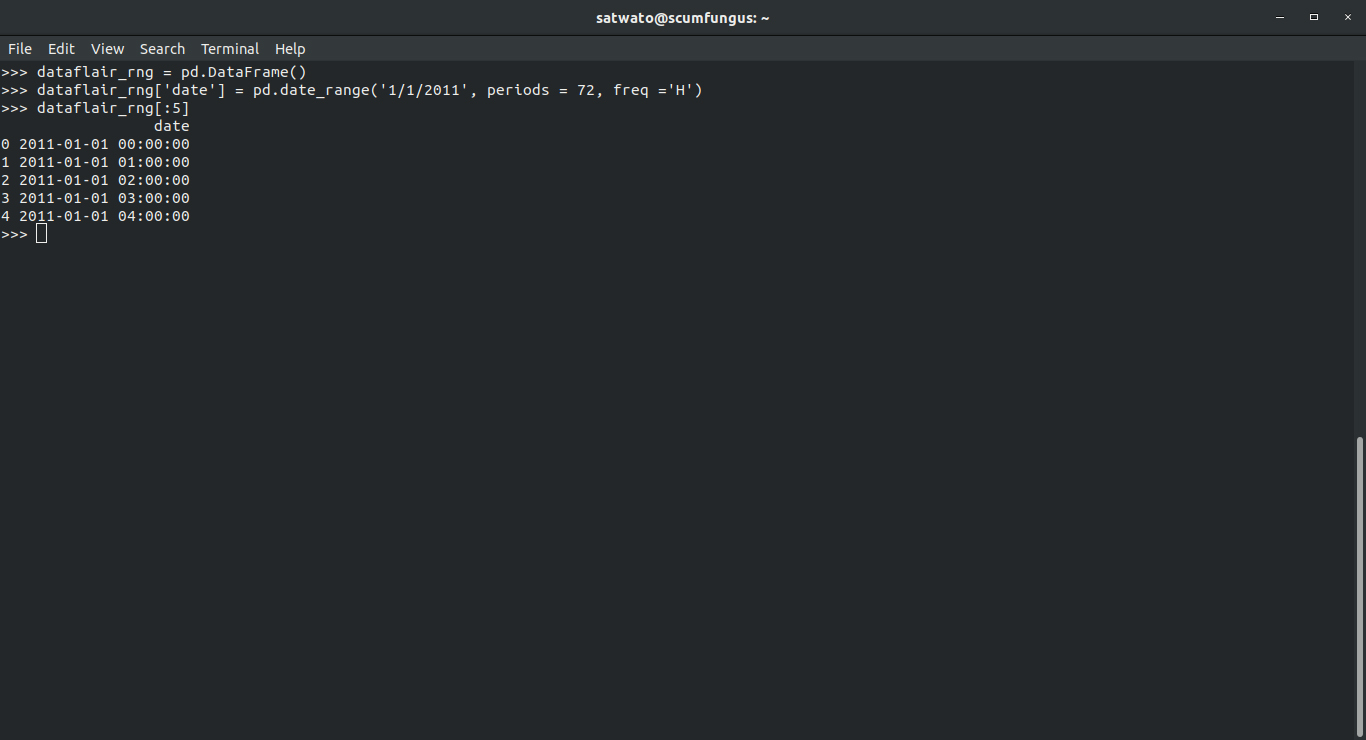
>>> dataflair_rng = pd.DataFrame()
>>> dataflair_rng['date'] = pd.date_range('1/1/2011', periods = 72, freq ='H')
>>> dataflair_rng[:5]
Output-
Don’t miss the opportunity to get a complete guide for Pandas Dataframe
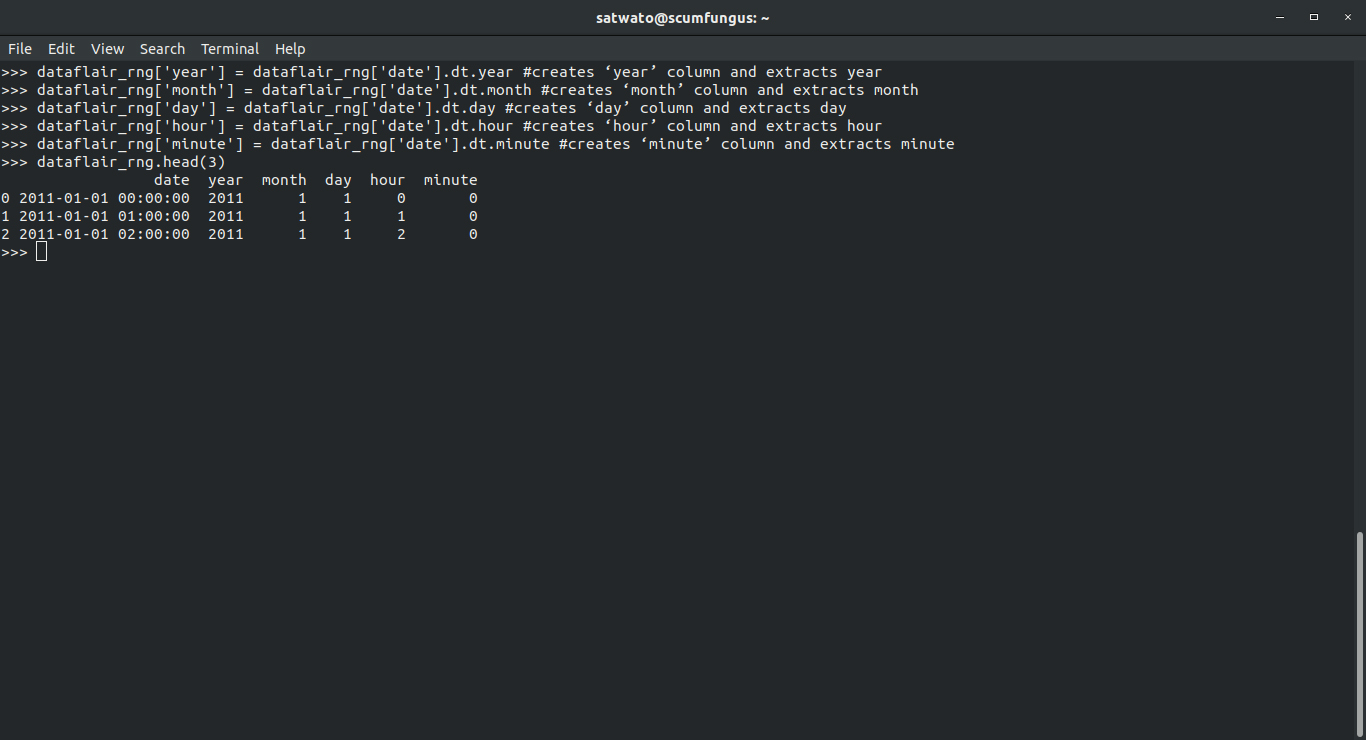
2. Breaking the time and date into separate features
>>> dataflair_rng['year'] = dataflair_rng['date'].dt.year #creates ‘year’ column and extracts year
>>> dataflair_rng['month'] = dataflair_rng['date'].dt.month #creates ‘month’ column and extracts month
>>> dataflair_rng['day'] = dataflair_rng['date'].dt.day #creates ‘day’ column and extracts day
>>> dataflair_rng['hour'] = dataflair_rng['date'].dt.hour #creates ‘hour’ column and extracts hour
>>> dataflair_rng['minute'] = dataflair_rng['date'].dt.minute #creates ‘minute’ column and extracts minute
>>> dataflair_rng.head(3)
Output-
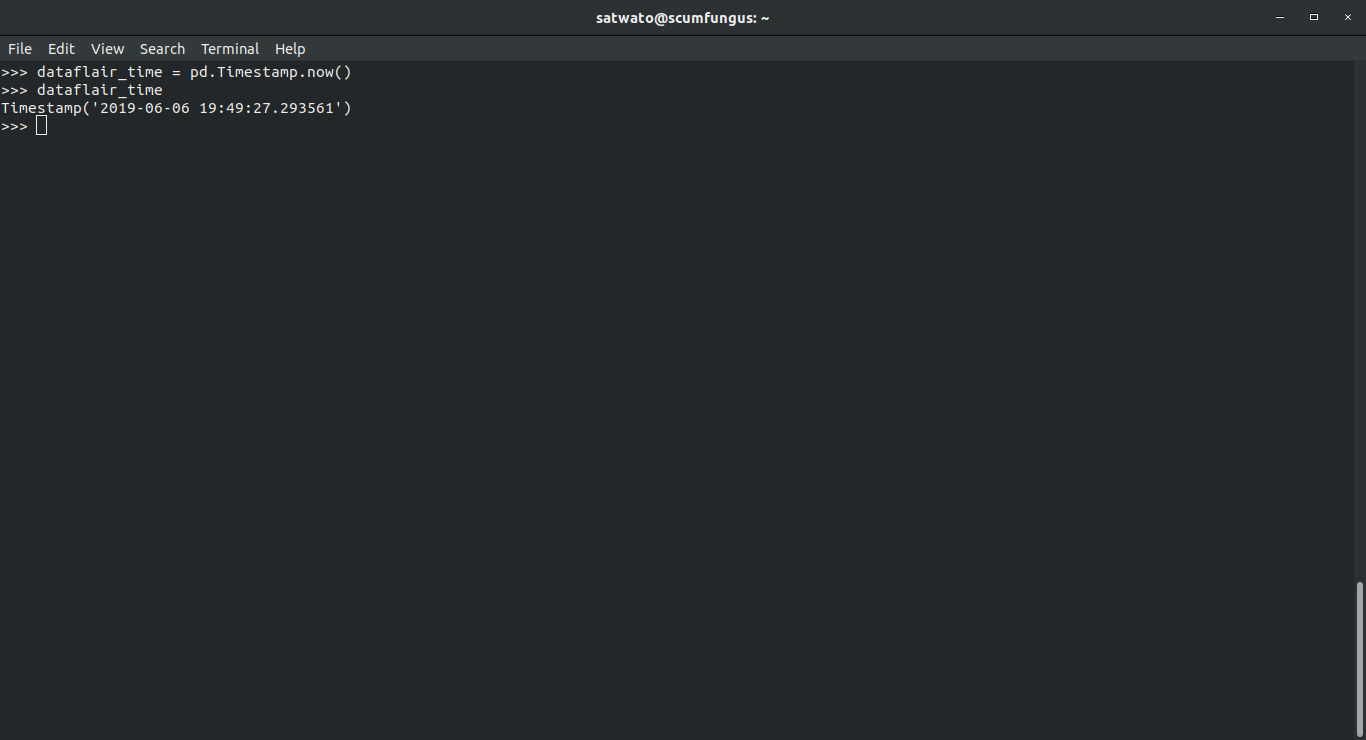
3. How to get the present time as a timestamp in Pandas?
The function .Timestamp.now() gives us the current time and date details.
>>> dataflair_time = pd.Timestamp.now()
>>> dataflair_time
Output-
3.1 Getting all the features separately from the timestamp
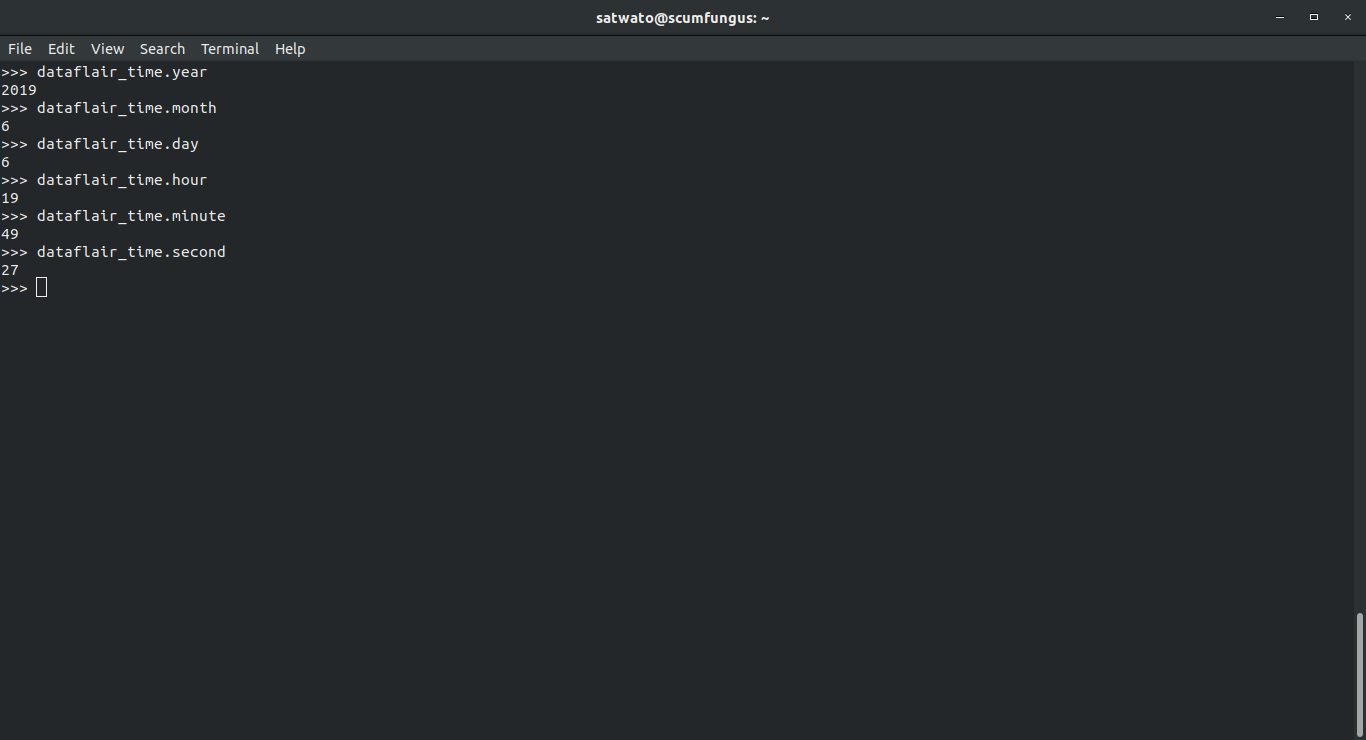
Using the .year, .month, .week, .day, .hour, .minute functions, we can extract the respective features from the Pandas timestamp.
3.1.1. Year
>>> dataflair_time.year
Output-
2019
3.1.2. Month
>>> dataflair_time.month
Output-
6
3.1.3. Day
>>> dataflair_time.day
Output-
6
3.1.4. Hour
>>> dataflair_time.hour
Output-
19
3.1.5. Minute
>>> dataflair_time.minute
Output-
49
3.1.6. Second
>>> dataflair_time.second
Output-
27
4. Pandas DateTimeIndex object
Extracting the elements of date and time from the DateTimeIndex object in Pandas. We can extract the date and time values present in each entry of the object.
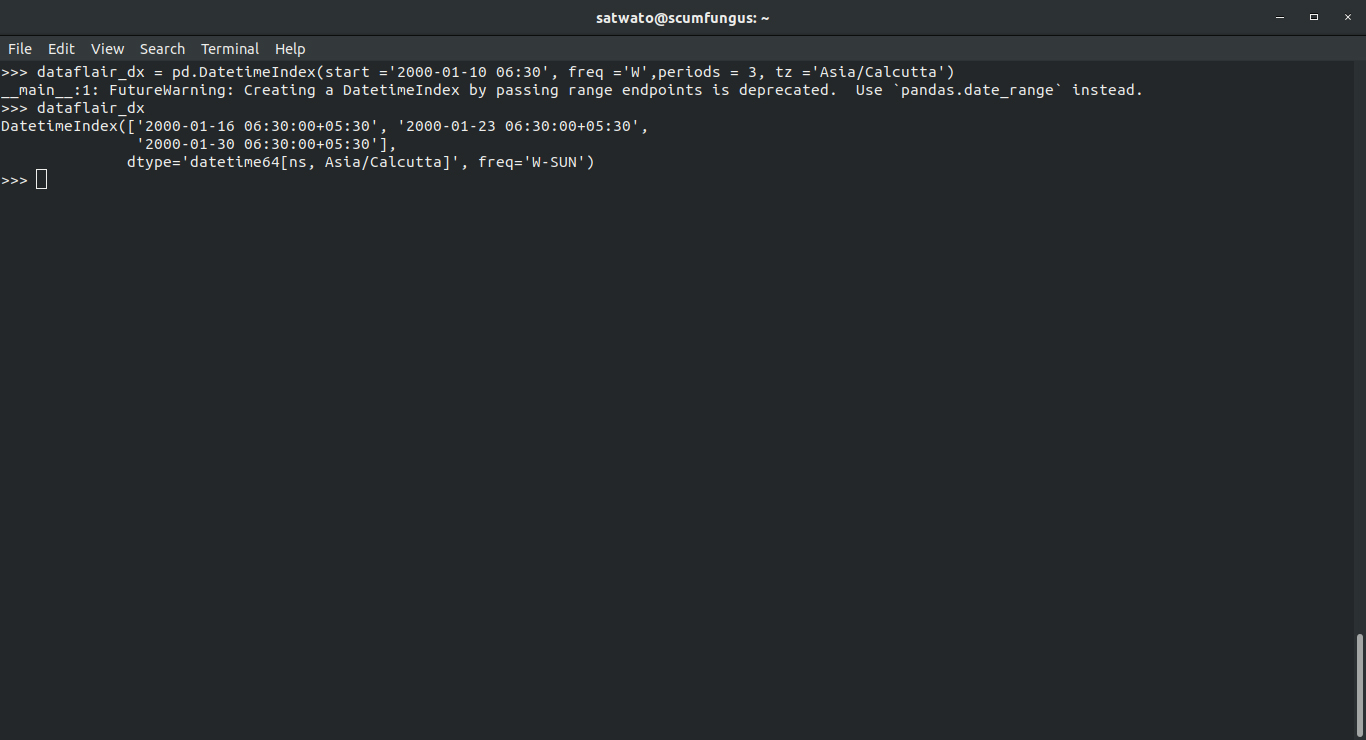
First, we create a Pandas DateTimeIndex object.
>>> dataflair_dx = pd.DatetimeIndex(start ='2000-01-10 06:30', freq ='W',periods = 3, tz ='Asia/Calcutta')
>>> dataflair_dx
Output-
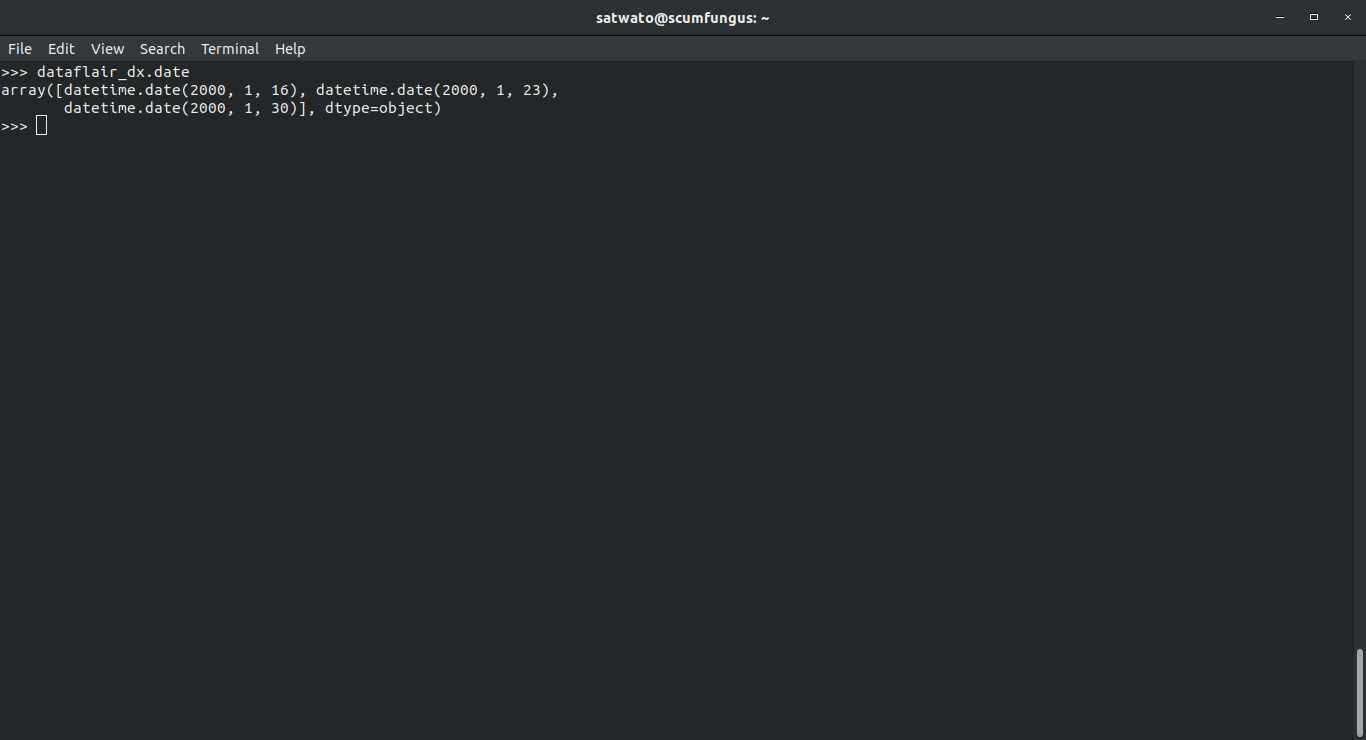
- Printing the date attributes
>>> dataflair_dx.date
Output-
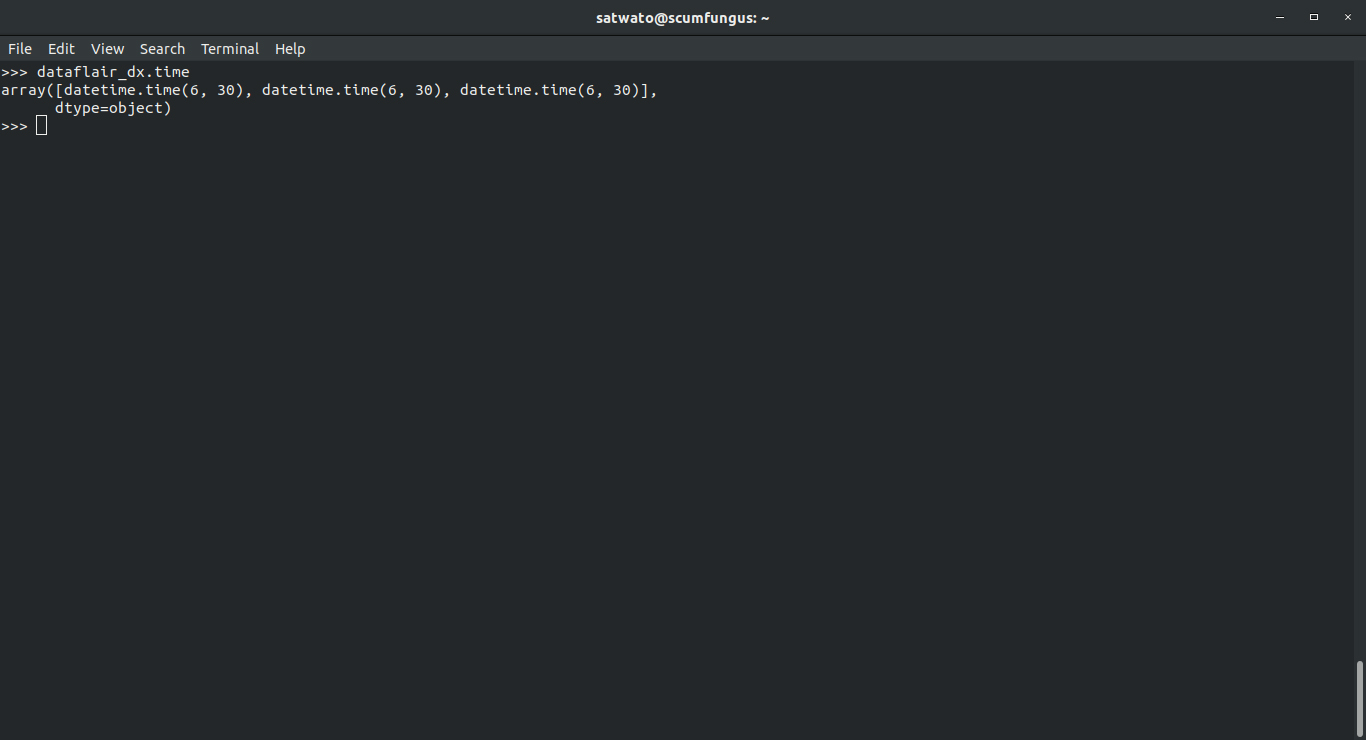
- Printing the time attributes
>>> dataflair_dx.time
Output-
5. Pandas TimeDelta
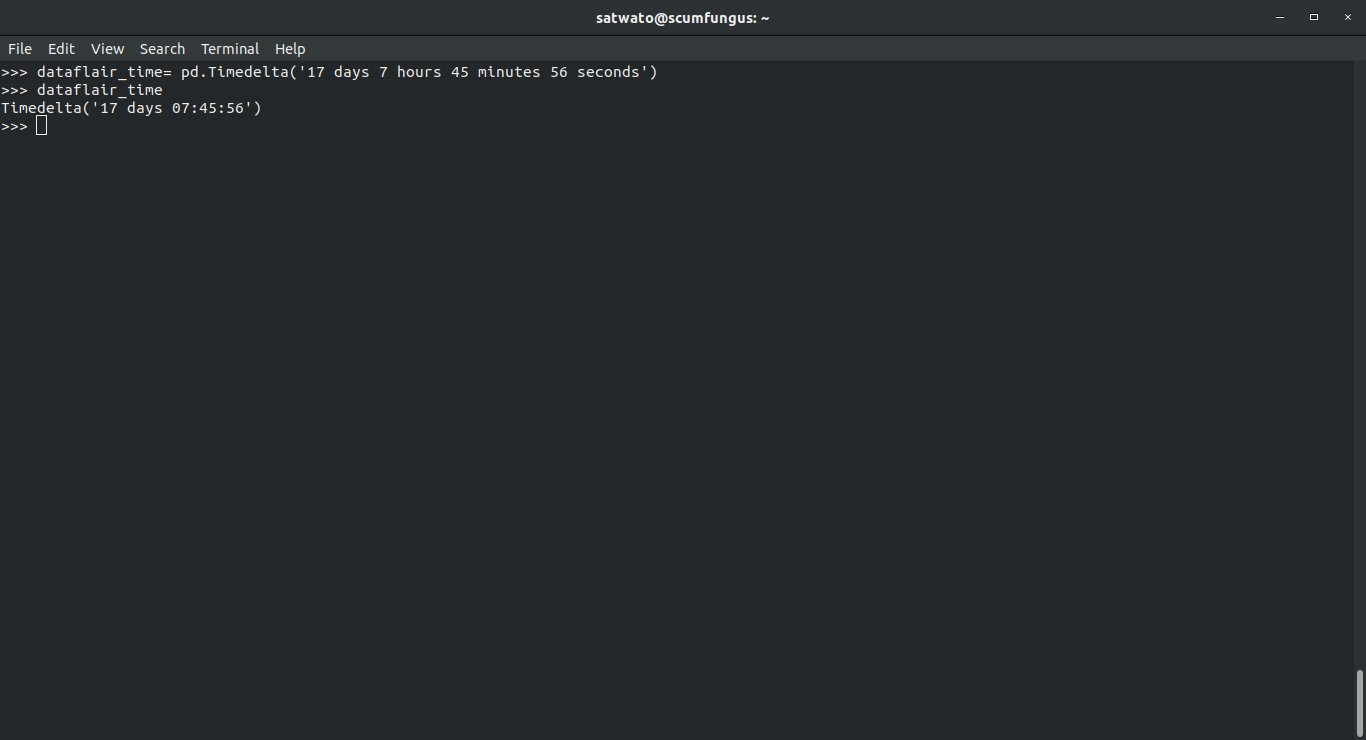
TimeDelta denotes the difference or change in time, in terms of days, hours, minutes and seconds. Using Pandas TimeDelta functions, we can convert strings and integers to TimeDeltas.
>>>dataflair_time= pd.Timedelta('17 days 7 hours 45 minutes 56 seconds') #with strings
>>>dataflair_time
Output-
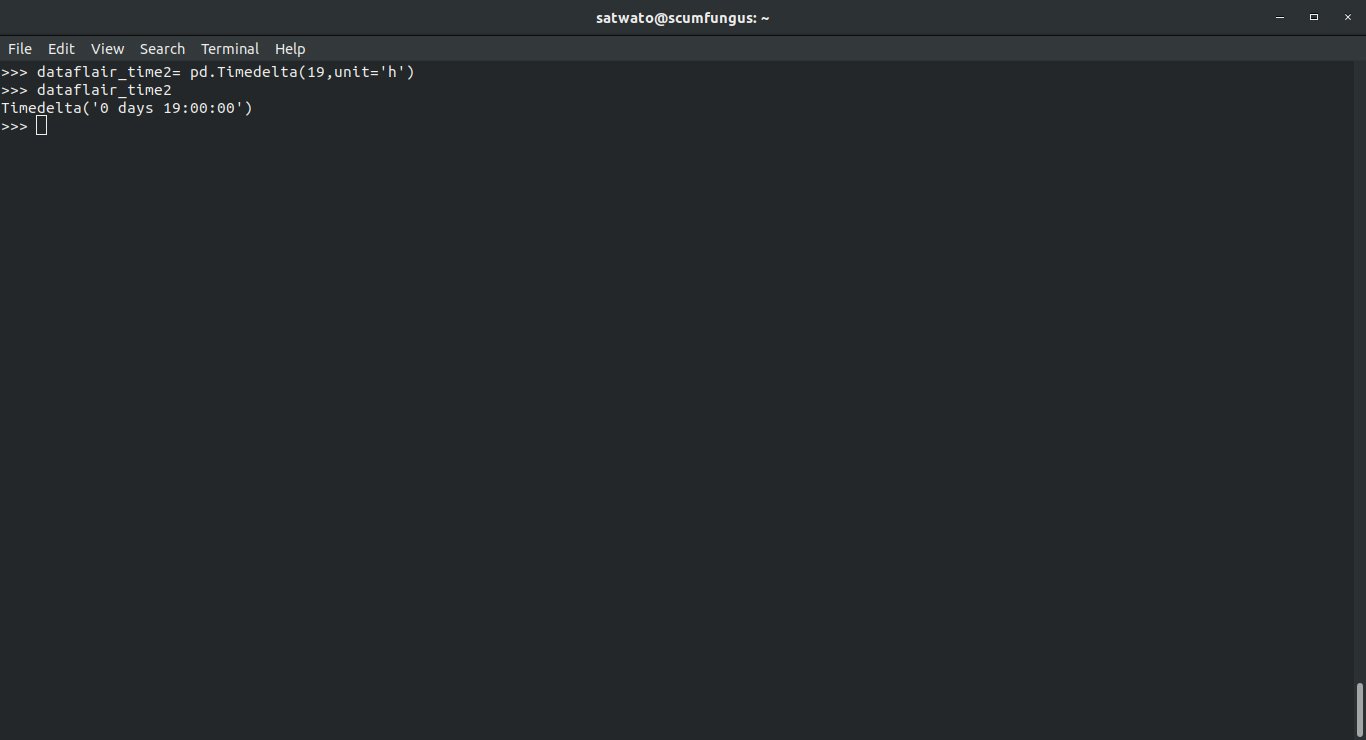
>>> dataflair_time2= pd.Timedelta(19,unit=’h’)
>>> dataflair_time2
Output-
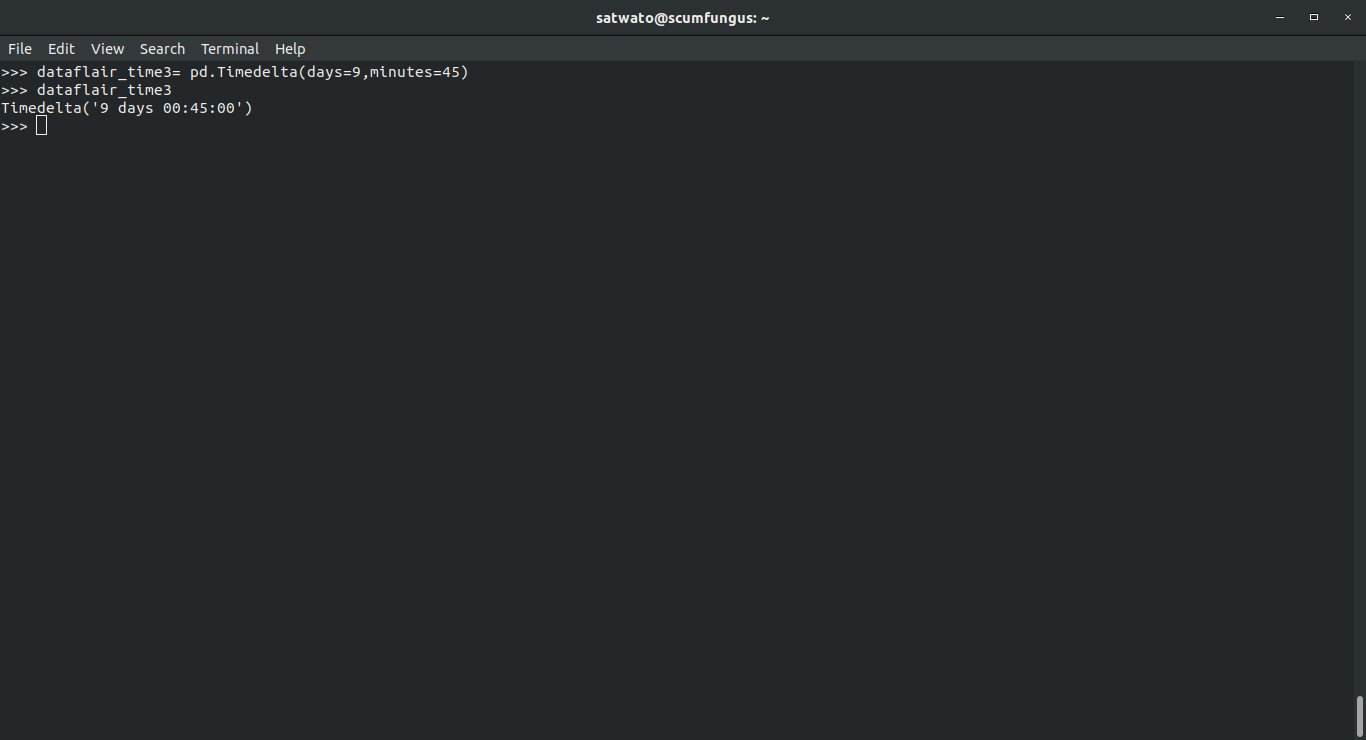
We can use data offsets with TimeDeltas in Pandas
>>> dataflair_time3= pd.Timedelta(days=’9’,minutes=’45’)
>>> dataflair_time3
Output-
It’s time to know about Pandas Series
6. Pandas Time Series
To index data by timestamps, we require Pandas time series. Let’s discuss the below example to understand it-
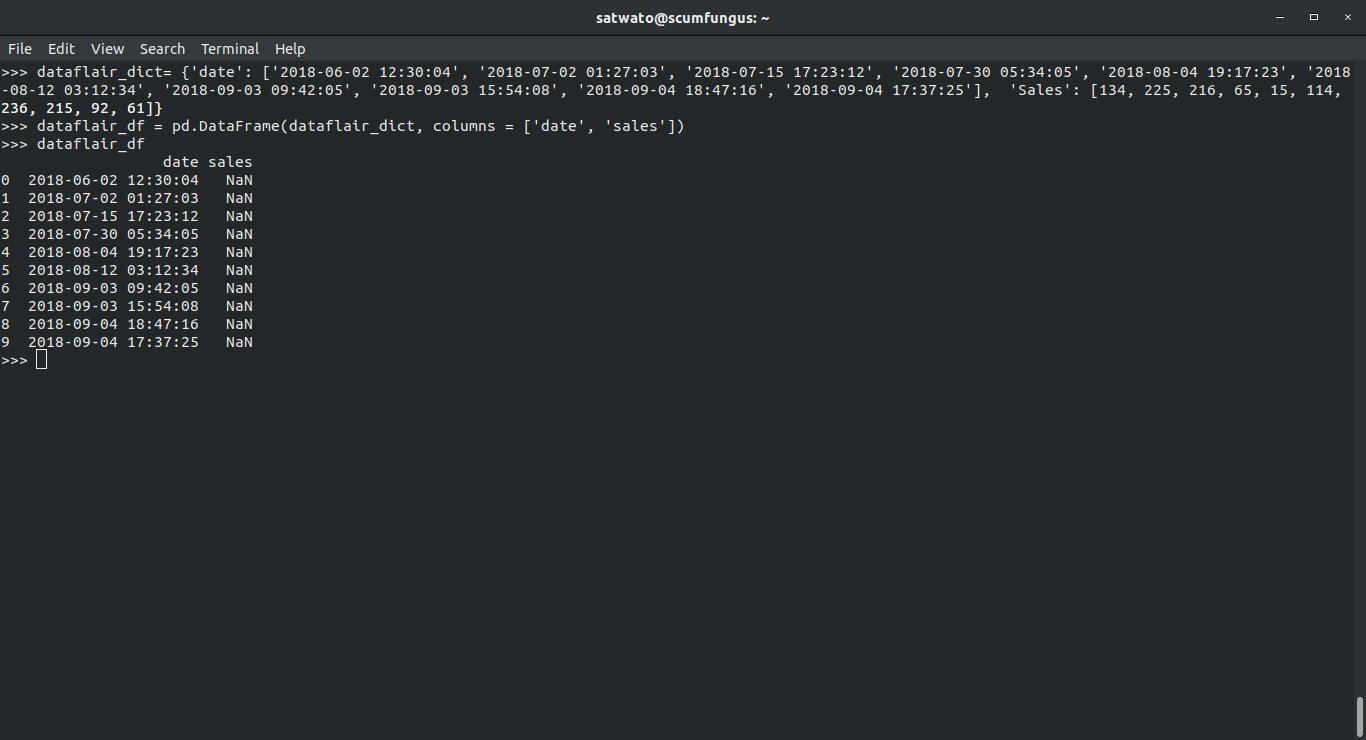
Let’s take a dataset:
>>> dataflair_dict= {'date': ['2018-06-02 12:30:04', '2018-07-02 01:27:03', '2018-07-15 17:23:12', '2018-07-30 05:34:05', '2018-08-04 19:17:23', '2018-08-12 03:12:34', '2018-09-03 09:42:05', '2018-09-03 15:54:08', '2018-09-04 18:47:16', '2018-09-04 17:37:25'], 'Sales': [134, 225, 216, 65, 15, 114, 236, 215, 92, 61]}
>>> dataflair_df = pd.DataFrame(dataflair_dict, columns = ['date', 'sales'])
>>> dataflair_df
Output-
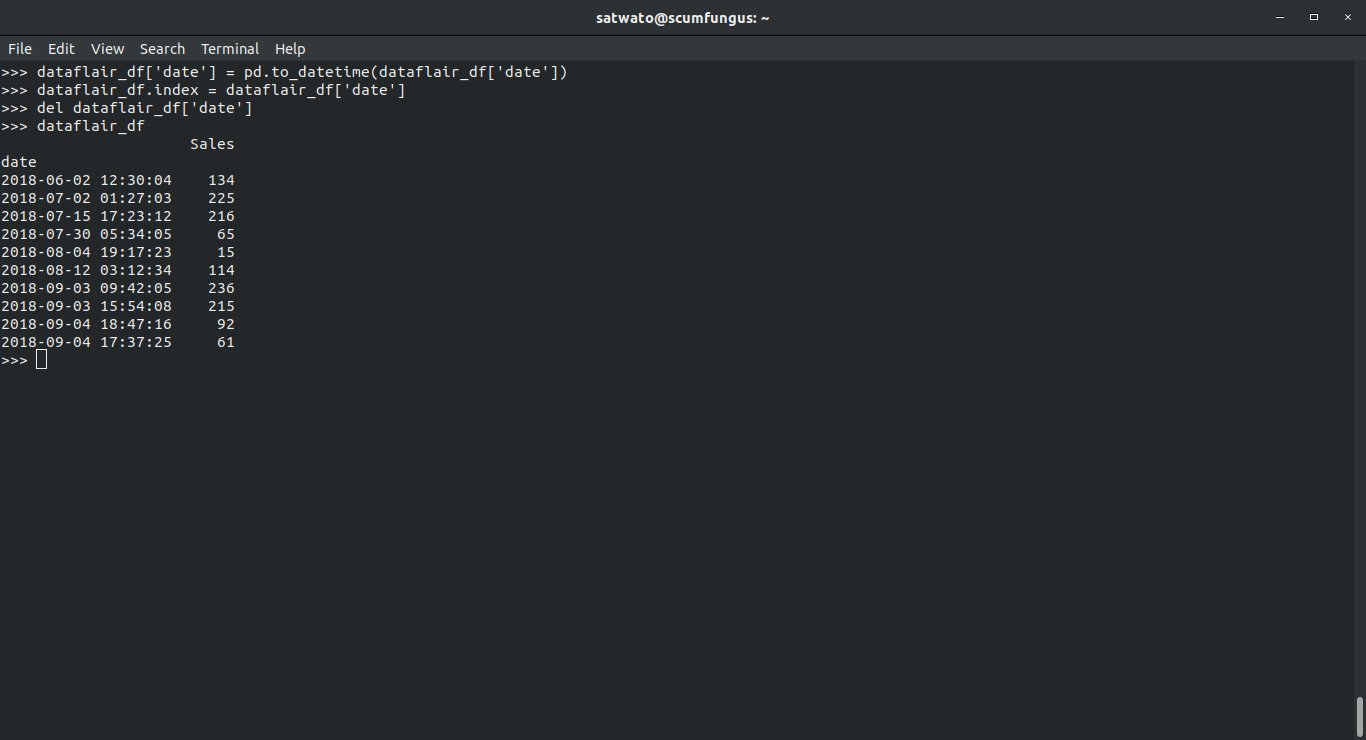
6.1 How to convert the dates to a TimeSeries object in Pandas?
>>> dataflair_df['date'] = pd.to_datetime(dataflair_df['date'])
>>> dataflair_df.index = dataflair_df['date']
>>> del dataflair_df['date']
>>> dataflair_df
Output-
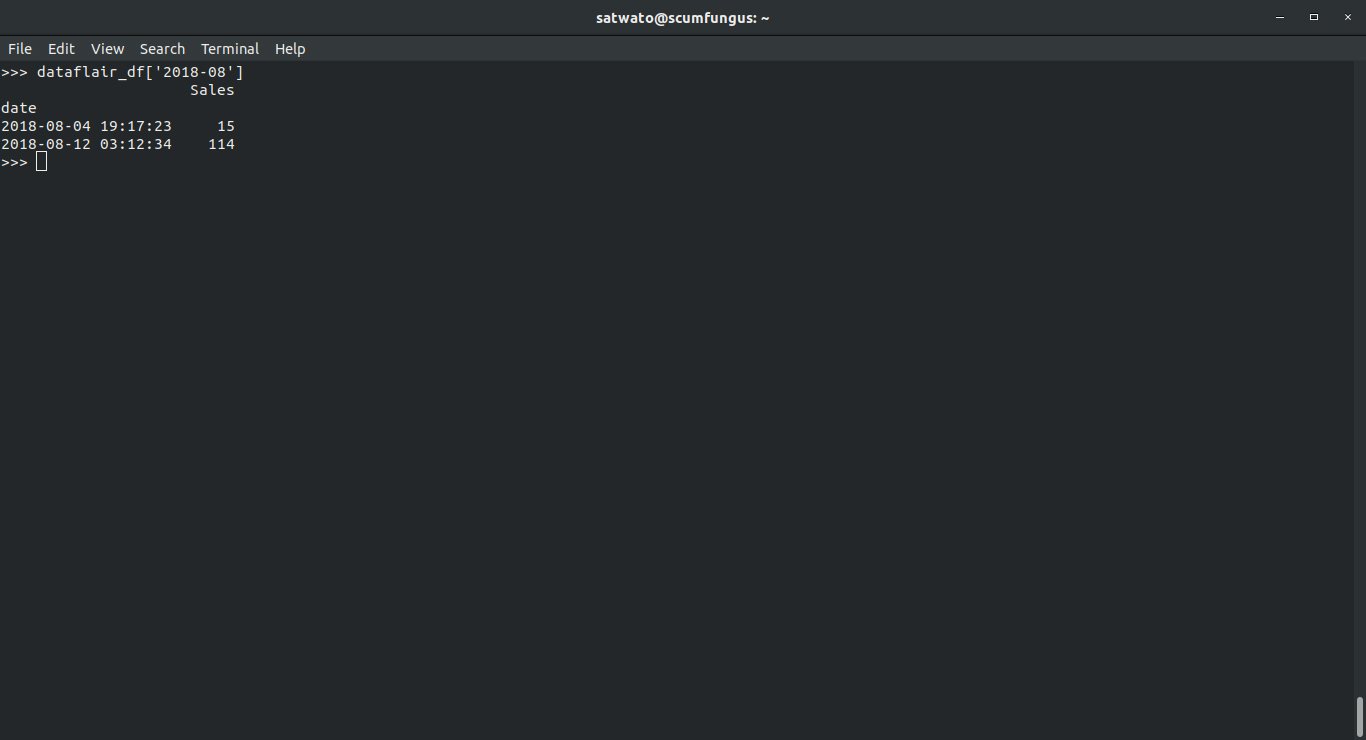
We can use TimeSeries properties to view specific events, like:
>>> dataflair_df['2018-08']
Output-
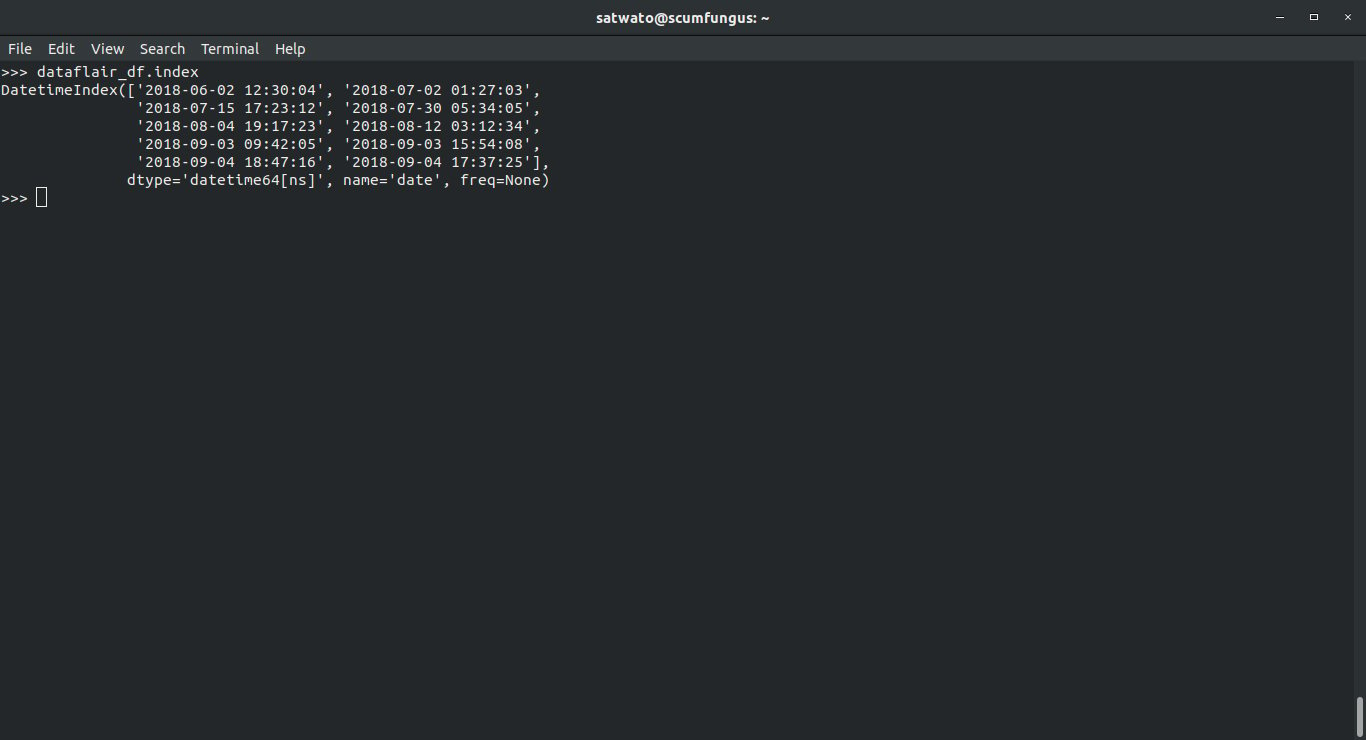
To view our TimeSeries object, we can use:
>>> dataflair_df.index
Output-
Summary
These were all the functions that you can manipulate with the help of Pandas datetime functionality. In addition, we discussed the timedelta and time series with the help of examples. Hope, you liked the article and practiced it well.
You can represent your data in the form of charts with the help of Pandas Visualization.
Don’t forget to comment below. We will be glad to know about your experience with us!
Your opinion matters
Please write your valuable feedback about DataFlair on Google


