Vmstat Command in Linux
Placement-ready Online Courses: Your Passport to Excellence - Start Now
In this article, we will learn everything about the vmstat command in Linux. We will start from ground zero by understanding the vmstat command, why it is used, what virtual memory is, The syntax of how to use the command, and the various options used with the vmstat command and its modes.
After covering all this, we will look at some theoretical examples to better understand the working of the vmstat command. Finally, we shall understand each output carefully by taking a better picture of the output field and the information the vmstat command gives us. So pay attention and make it to the end of the article!
What is vmstat?
Vmstat is an abbreviation for Virtual Memory Statistics. Vmstat is a command-line-based built-in monitoring utility in Linux-based operating systems that gives us various information regarding memory, system processes, paging, block I/O, disk, CPU scheduling, and so on.
The vmstat command is also known as a virtual memory statistic reporter due to its unique features. In a nutshell, the vmstat command helps us identify and diagnose problems in your operating system.
The first report produced by the vmstat command gives us the average details since the last reboot. However, the subsequent reports provide information over a sampling period.
What is Virtual memory?
We saw that vmstat gives us various information regarding virtual memory, but what is virtual memory in the first place? Well, let us take this topic from the basics — We all know that our computers are fitted with a limited amount of memory called RAM (Random Access Memory).
But what happens if the RAM is full and the kernel and the applications in your system demand more memory? Well, at least in Linux and Unix-like operating systems, your computer makes use of a reserved area of your hard drive space called the “swap space”, this can be used as though it were an extension of the RAM in your CPU. This “swap space” is what we call “virtual memory”.
For obvious reasons, the speed of the virtual memory is way slower than that of memory held in RAM. Apart from this, the only other trade-off between RAM and virtual memory is that virtual memory provides a way for Linux operating system to manage its memory demands as a single virtual memory places increased burdens elsewhere on the computer.
Syntax of Linux vmstat command
The syntax of the vmstat command may look slightly intimidating at first, but when we look at the different fields present in the syntax and understand what they are for, it will become a cakewalk. The syntax of the vmstat command is:
vmstat <options> <delay <count>>
Here are the fields present in the syntax of the vmstat command:
1. <options>
This field takes in a range of options that specify how the vmstat command should work and the output.
2. <delay>
This field specifies the interval between 2 updates. If you don’t specify a delay, the default value will be taken as infinite.
3. <count>
This field specifies the number of updates printed after each interval. If you don’t specify anything in this field, the default value will be taken as infinite.
Options used with linux vmstat command
Unlike most of the commands in Linux, the vmstat command has only a few options associated with it. Let us take a brief look at each one of them:
1. -a
This option displays active and inactive memory. You can also write this option as “–active.”
2. -f
This option switches the displays of the number of forks since boot. You can also write this option as “–f0rks.”
3. -m
This option displays the contents in the address /proc/slabinfo. You can also write this option as “–slabs.”
4. -n
This option displays the header only once rather than periodically. You can also write this option as “–one-header.”
5. -h
This option prints out the help menu of the vmstat command as shown:

6. -d
This option reports disk statistics. You can also write this option as “–disk.”
7. -D
This option reports some summary statistics about disk activity. You can also write this option as “–disk-sum.”
8. -p
This option prints detailed statistics about the partition. You can also write this option as “–partition.”
9. -S
This option switches outputs between 1000 (k), 1024 (K), 1000000 (m), or 1048576 (M) bytes. You can also write this option as “–unit.”
10. -s
This option displays a table that contains various event counters and memory statistics. You can also write this option as “–stats.”
11. -V
This option prints the information regarding the version of the vmstat as shown:
How to install vmstat?
The reason I did not address this at the beginning is that most of the Linux distributions already come with the vmstat command preinstalled. However, if your Linux distro does not have it, or if you uninstalled it, you can always install it using the commands shown below with respect to your Linux distro:
Installing vmstat on Debian-based Linux distributions
If you want to download vmstat on Debian-based Linux distros like Kali, Ubuntu, Deepin, ParrotOS, Mint, MX Linux, Pure OS, AntiX, etc., use the command shown below:
sudo apt-get install sysstat
Installing vmstat on RHEL-based Linux distributions
If you want to download vmstat on RHEL-based Linux distros like Clear OS, Oracle Linux, Alma Linux, Rocky Linux, Cent OS, etc., use the command shown below:
sudo yum install sysstat
Installing vmstat on Fedora-based Linux distributions
If you want to download vmstat on Fedora-based Linux distros like Berry Linux, Qubes, Fedora spins, Clear OS, Korora, Hanthana, Arquetype, etc., use the command shown below:
sudo dnf install sysstat
Installing vmstat on Arch Linux-based distributions
If you want to download vmstat on Fedora-based Linux distros like Manjaro, ArcoLinux, Chakra, Anarchy, ArchBang, Bluestar, etc., use the command shown below:
sudo pacman -S sysstat
Understanding output of vmstat command
If we simply run the vmstat command by not pairing it with an option, we get the output shown below:
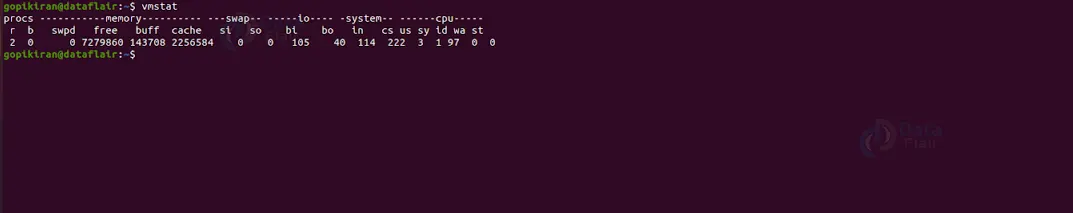
In the screenshot shown above, we can see that the vmstat gives us a ton of information through various columns. Let us understand what each column is for in brief:
1. Procs – Shows process statistics
a. r – Count of active processes.
b. b – Count of sleeping processes.
2. Memory – Shows memory statistics
a. swpd – Total virtual memory available.
b. free – Total free memory available.
c. buff – Total memory temporarily being used as a data buffer.
d. cache – Total cache memory.
3. swap – Statistics on swap space
a. si – Shows the rate of swapping-in memory from disk.
b. so – Shows the rate of swapping-out memory to disk.
4. io – Input/output statistics
a. bi – Number of blocks received from a block device per second.
b. bo – Number of blocks sent to a block device per second.
5. system – Scheduling statistics
a. in – Number of systems interrupts.
b. cs – Number of context switches per second.
6. cpu – Central Processing Unit statistics
a. us – Percentage of CPU time spent on non-kernel processes.
b. sy – Percentage of CPU time spent on kernel processes.
c. id – Percentage of idle CPU.
d. wa – Percentage of CPU time that is spent waiting for I/O.
e. st – Percentage of CPU time that is stolen by a virtual machine.
Now that we have laid down the fundamentals let us move to some examples of the vmstat command in the terminal of Ubuntu 20.04. First, let us look at each output of the command we execute in detail to understand the information the vmstat command is giving us.
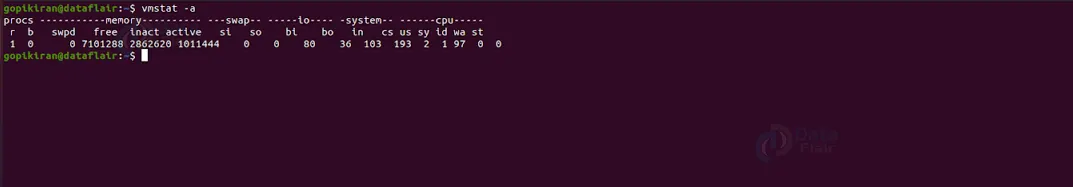
Displaying active and inactive system memory
If you want to display the active and inactive system memory, pair the vmstat command with the option “-a”. The only difference the option “-a” makes to the output is that it repeats the fields “buff” and “cache” of the normal vmstat command and with the fields “inact” and “active”. Therefore, use the syntax “vmstat -a.”
Memory and scheduling statistics
We have already seen that the normal vmstat command has two fields regarding memory and scheduling statistics. But if you want to print detailed information about memory, event counters, and CPU scheduling statistics, run the vmstat command with the option “-s” as shown below:
vmstat -s
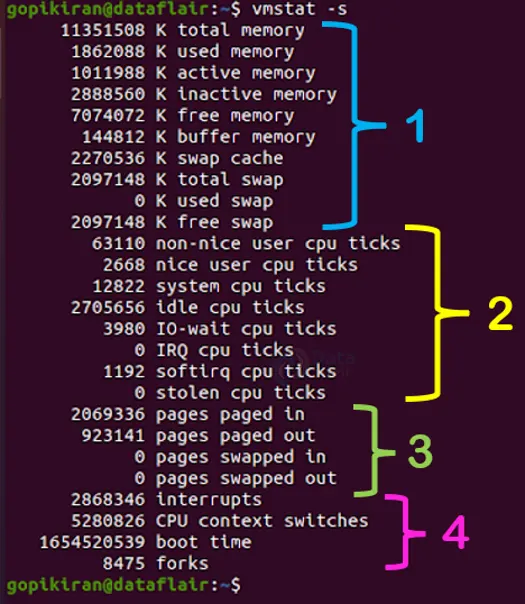
In the screenshot shown above, we have different sections (numbered in different colours) that give information about memory and scheduling statistics. First, let us look at what each line means:
1. Amount 0f memory used (highlighted in blue)
1st line – Total physical memory.
2nd line – Currently used memory.
3rd line – Active memory.
4th line – Inactive memory.
5th line – Free memory.
6th line – Buffer memory.
7th line – Cache memory.
8th line – Swap memory information.
2. CPU statistics (highlighted in yellow)
1. Non-nice CPU ticks – Number of times the CPU was used for high-priority processes.
2. Nice CPU ticks – Number of times the CPU was used for lower-priority processes.
3. System CPU ticks – Number of times the CPU was used for kernel processes.
3. Idle CPU ticks – Number of times the CPU was idle.
4. IO-wait – Number of times the CPU was used for input/output management.
5. IRQ – Number of times the CPU received interrupt requests.
6. softirq – Number of times the CPU received software interrupts.
7. stolen CPU ticks – Number of times a virtual machine stole CPU time.
3. Values related to memory paging (highlighted in green)
1st line – Total pages paged in from virtual memory.
2nd line – Total pages paged out to virtual memory.
3rd line – Total pages read from swap memory.
4th line – Total pages written to swap memory.
4. Event counters (highlighted in pink)
1st line – Number of interrupts since boot.
2nd line – Number of context switches performed.
3rd line – Timestamp for the last boot time.
4th line – Total number of forks.
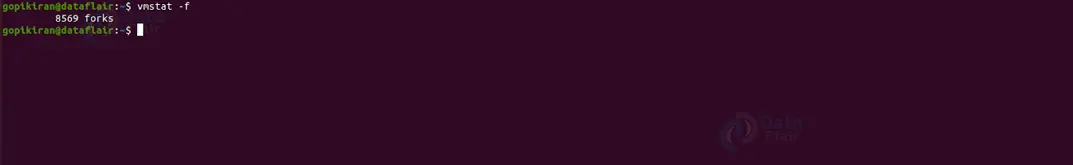
Displaying the number of forks since the last boot
If you want to display forks (new processes created from existing running ones) created since system startup, use the option “-f” as shown below:
Displaying a quick summary of Disk statistics
Pait the vmstat command with the option “-D” to display a quick summary statistic of all disk activity. Use the command “vmstat -D” to do the same.
Displaying disk statistics
If you are not satisfied with the quick summary of the disk statistics and want a detailed statistic on each disk usage, use the vmstat command along with the option “-d” as shown below:
vmstat -d
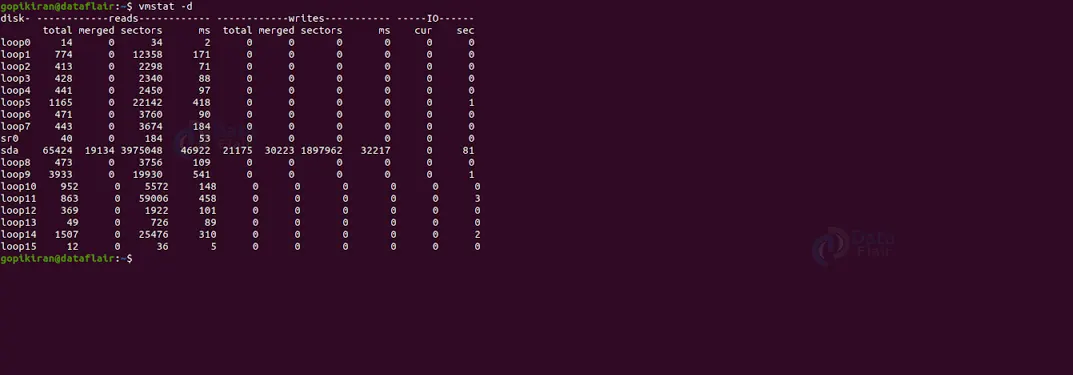
The above screenshot consists of 3 columns for different pieces of information. First, let us take a look at the fields present in this output:
1. reads
a. total: Total number of disk reads.
b. merged: Total number of grouped reads.
c. sectors: Total number of sectors that have been read in.
d. ms: Total time (in milliseconds) it took to read data from the disk.
2. writes
a. total: Total number of disk writes.
b. merged: Total number of grouped writes.
c. sectors: Total number of sectors written to.
d. ms: Total time (in milliseconds) it took to write data to the disk.
3. io
a. cur: Total current disk reads or writes.
b. sec: Total time (in seconds.) spent for any in-progress reads or writes.
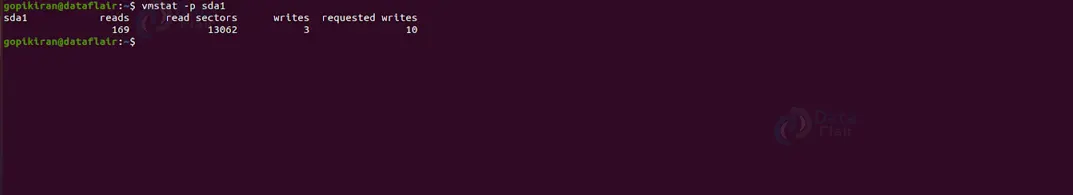
Displaying partition statistics
To print a report related to a specific partition, use the option “-p” followed by the name of the partition. Use the syntax shown below:
vmstat -p <partition name>
Displaying time stamp information for updates
To you want to get a timestamp along with a requested output, run the vmstat command with the option “-t” as shown:
vmstat -t
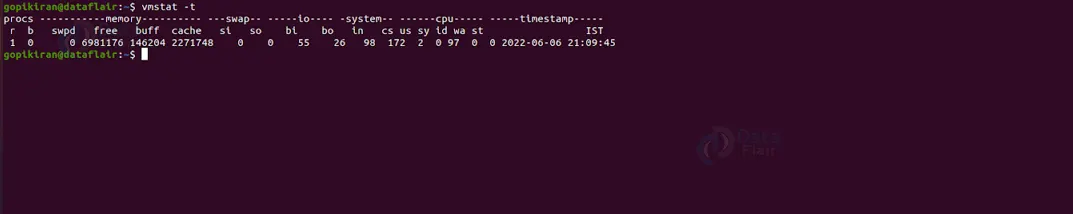
The output in the screenshots shown above is exactly the same as that of the regular vmstat command with only one difference – the added timestamp column.
Using a delay value
We saw in the syntax of the vmstat command that we can specify a delay value that specifies the time elapsed between each output update (it is expressed in seconds). To specify the same, use the syntax shown below:
vmstat <delay>
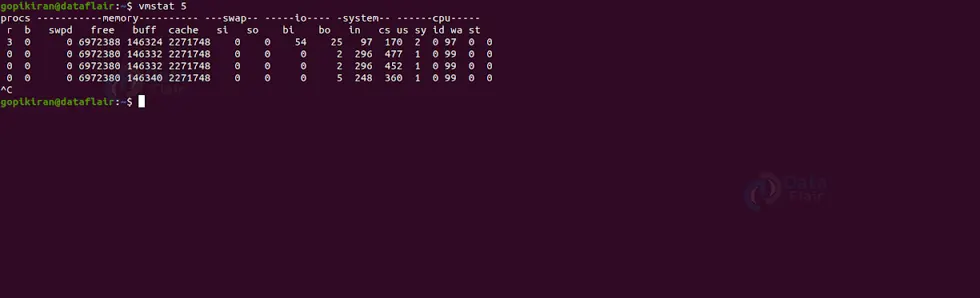
I gave a 5-second delay between each report update in the above screenshot.
Using a count value
We also saw that we could specify the count value next to the delay in the syntax of the vmstat command. The count value specifies the number of updates to carry out before the output stops refreshing. To specify the same, use the following syntax:
vmstat <delay <count>>
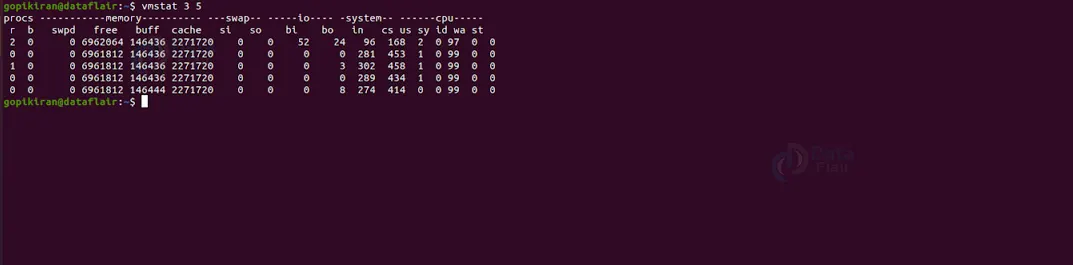
In the screenshot shown above, the command I used will print five reports with a delay of 3 seconds each.
Changing units in Linux
To change the units, we can run the vmstat command along with the option “-S” followed by any one of the following arguments:
1. k (Kilobytes) – 1000 bytes.
2. m (megabytes) – 1000000 bytes.
3. K (Hexadecimal kilobytes) – 1024 bytes.
4. M (Hexadecimal megabytes) – 1048576 bytes.
Use the following syntax:
vmstat -S <k/m/K/M>

Display statistics for slab
Before we look at how to generate the statistics for the slab, let us look at what it is in the first place. The slab is a memory management system that efficiently allocates memory to various data objects the kernel handles.
To generate a report with slab statistics, execute the vmstat command with the option “-m” as shown:
vmstat -m
You must note that to see the statistics of the slab, you need to run the command either as the root user or with elevated privileges (using sudo).
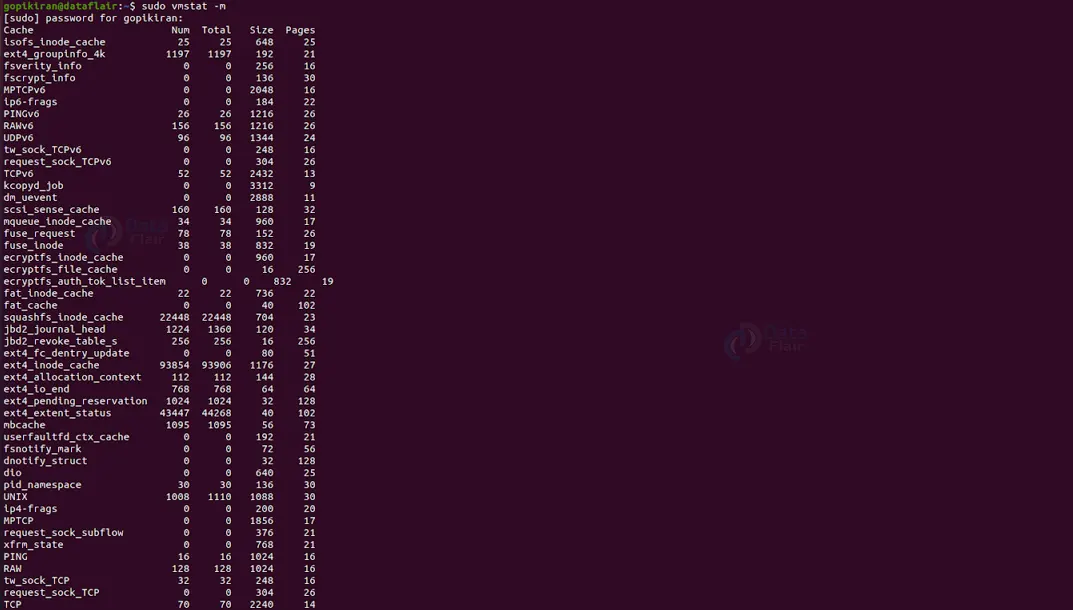
Let us understand the output fields in the screenshot shown above.
- Cached – The name of cached data.
- Num – Total active objects in the num cache.
- Total – number of available objects in a specific cache.
- Size – The size of each cached object.
- Pages – Number of memory pages containing a cached object.
Displaying a header-only once
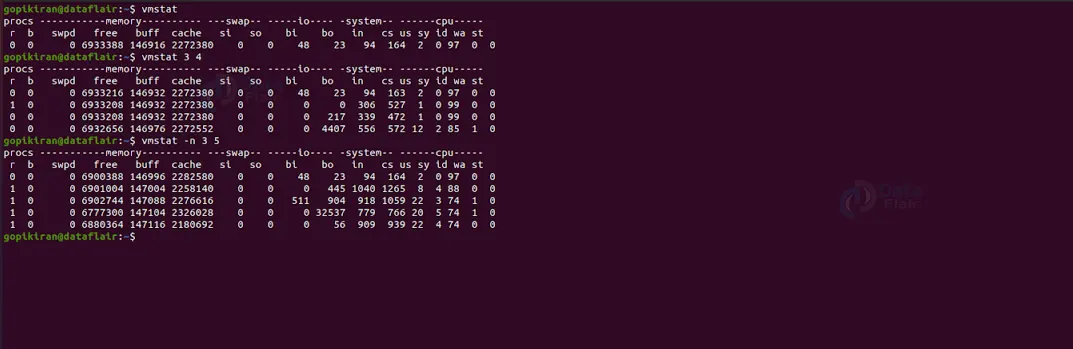
If you want to display a header only once instead of printing it periodically, use the option “-n” as shown below:
vmstat -n
Summary
As you have seen, the vmstat command is a simple tool that gives us information about the virtual memory in our systems. You have now learned what vmstat is, why we use it, what virtual memory is, how to install vmstat, and the syntax and options used along with the vmstat command.
We have also looked at many examples of how to use the various options to produce various outputs and statistics. But, most importantly, we understood how to read the output and what they mean.
If you are Happy with DataFlair, do not forget to make us happy with your positive feedback on Google


