Traceroute Command in Linux
We offer you a brighter future with industry-ready online courses - Start Now!!
In this article, you will learn all there is to the traceroute utility. We shall go through what Linux traceroute command is, how it works, and How to install it. We will also be looking into the syntax of the traceroute command, and the different options used with the traceroute command. In the end, we will also be looking into how to traceroute, as we will g through many practical examples of the traceroute command.
What is traceroute?
Traceroute is a command-line-based tool in Linux-based operating systems that allows you to investigate the routes of network packets. The traceroute command print the path or route that the network packets take to a network host.
In slightly more intimidating words, it is a network troubleshooting tool that helps us determine the number of hops a packet’s traveling path takes to reach its destination.
The traceroute command is also used to troubleshoot sluggish network connections. Since traceroute maps packet paths in the network, it also aids in the discovery of possible routes of information from the source to the destination. It can also calculate the time taken to transfer between points.
Traceroute can also help you identify the limiting factor of a network packet journey and where traffic slows down between the source and destination.
How does traceroute work?
The traceroute tool works by sending packets of data to the target server, computer, or website and recording any transitional steps through which the packets travel. The output upon running the traceroute command will be the IP address and domain names through which the packets pass.
The output entries also show how long it took for the packets to reach each destination. We shall be looking at how to understand the output screen in the following sections, so don’t worry.
Let us go a little deeper and more technical to understand how the traceroute tool works. When we run the traceroute command, it sends out ICMP (internet control message protocol) packets to every router transferring between the source and the destination.
The traceroute tool acts as a series of ping commands (another Linux-based command similar to traceroute). Unlike ping, which requests a response from the destination, traceroute gathers the intermediate information also.
Understanding the output of traceroute
When you run a traceroute command, the output displays the following:
1. The IP address of the router that received the network packet
2. The time it took to get a response for each of the 3 probes.
Let us understand this concept by taking an example. I ran a traceroute command to reach the DataFlair host at 172.66.42.233 from a local machine using the traceroute command.
In return, I got details regarding the hops, the time it took, and the names of the routers along with their IP address.
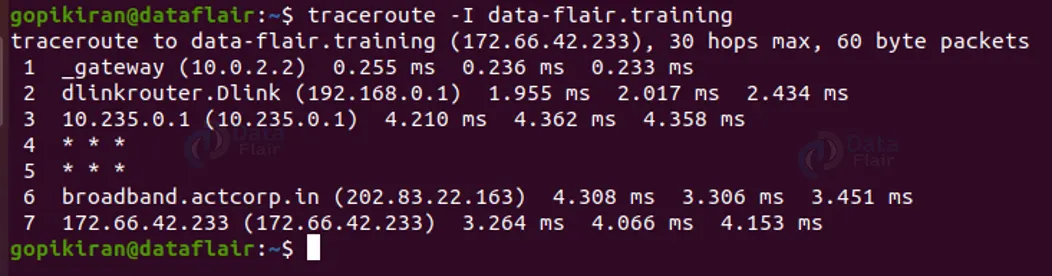
Let us get a better picture of the output. In total, the packet took 7 hops to reach from my system to the DataFlair host.
The first hop was through my wifi router (Dlink router) with IP address 192.168.0.1 and the subsequent column represents the time it took to get a response for each of the 3 probes.
On the 7th hop, the packet successfully reached the host at 172.66.42.233 through the router “broadband.actcorp.in” with IP address 202.83.22.163 at hoop number 6.
Therefore the first column of the output represents the hop count, the second column represents the IP address of the hop (will display name if available) and the remaining 3 columns represent the time it took to get a response for each of the 3 probes.
Installing traceroute
Traceroute does not come prepackaged into your system, instead, you have to install traceroute using the terminal. Here is the command you need for installing traceroute based on your Linux operating system.
1. Installing traceroute on Fedora-based Linux operating systems
If your Linux distribution is based on Fedora Linux (like clearOS, korora, Fedora spins, hanthana, Berry Linux, and many more) use the command given below to install traceroute on your system.
sudo dnf install traceroute
2. Installing traceroute on Arch-based Linux operating systems
If your Linux distribution is based on Arch Linux (like manjaro, ArcoLinux, Bluestar, Garuda, chakra, EndeavorOS, Artix Linux, and many more) use the command given below to install traceroute on your system.
sudo pacman -S traceroute
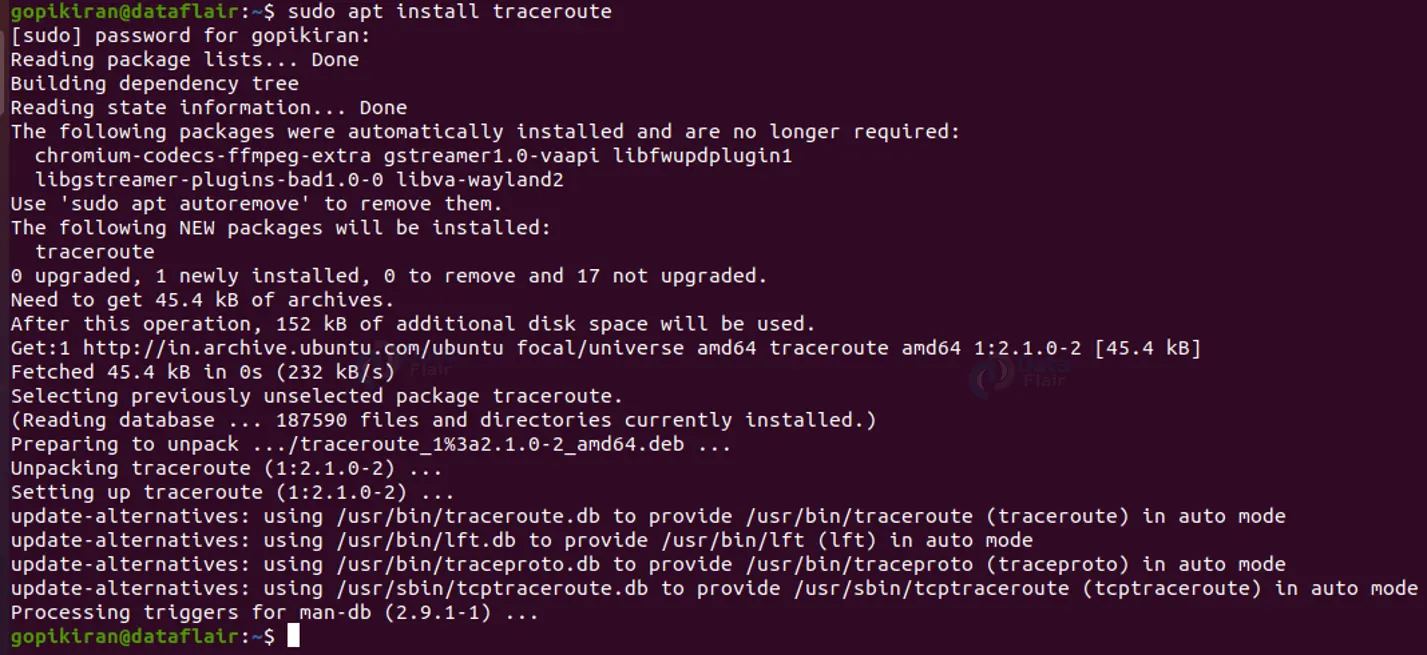
3. Installing traceroute on Debian-based Linux operating systems
If your Linux distribution is based on Debian (like Ubuntu, kali, AntiX, pureOS, Deepin, Mint, ParrotOS, MX Linux, and many more) use the command given below to install traceroute on your system.
sudo apt install traceroute
4. Installing traceroute on Open SUSE-based Linux operating systems
If your Linux distribution is based on Open SUSE (like tumbleweed and leap) use the command given below to install traceroute on your system.
sudo zypper in traceroute
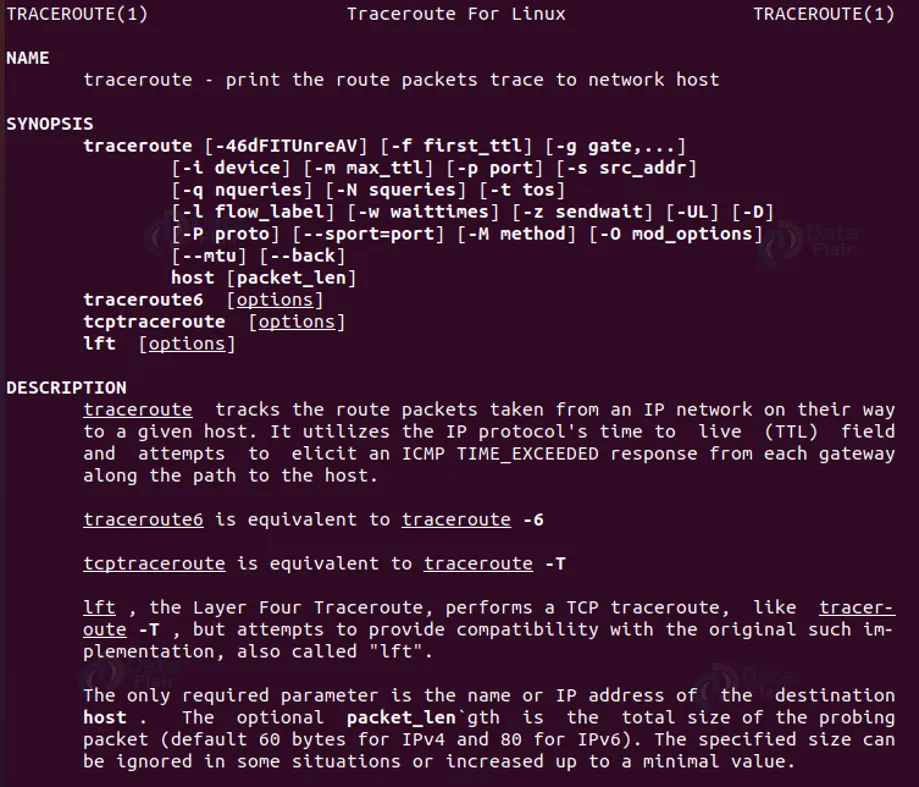
Syntax of the traceroute command
Now that you have installed traceroute, let us see the general syntax for using the traceroute command.
tracerout <options> host_adress <pathlength>
Options used with Linux traceroute command
In the syntax, there is a field for us to put different options that will allow us to get desired outputs. We can also combine 2 or more options to optimize our result. Let us take a look at the different available options that we can use with the traceroute command.
1. –help
This option displays the help message which contains the syntax, all the options, and information regarding the tool.
2. -4
This option specifically forces IP4 address tracerouting.
3. -6
This option specifically forces IP6 address tracerouting.
4. -I
This option uses ICMP ECHO for the probes
5. -T
This option uses TCP SYN for the probes
6. -d
This option enables socket level debugging
7. -F
This option does not fragment probe packets.
8. -f <first ttl>
This option specifies what TTL tracerouting should start. If you give no value, it will take the default value which is 1.
9. -g <gateway>
This option tells the traceroute to add an IP source routing option to the ongoing packet that tells the network to route the packet through the specified gateway.
10. -i <interface>
This option specifies the interface through which the traceroute should send packets. Based on the routing table, the interface is automatically selected.
11. -m <max ttl>
This option specifies the maximum number of hops the traceroute will probe. If no value is specified, the tool takes the default value as 30.
12. -N <squeries>
This option specifies the number of probe packets sent out simultaneously. If no value is specified, the tool takes the default value as 16.
13. -n
This option does not try to map IP addresses to hostnames when displaying them.
14. -p <port>
This option specifies the destination port base traceroute uses for UDP tracing.
15. -t <tos>
This option sets the TOS (type of service) and precedence value for IPv4.
16. -I <flow label>
This option uses the flow table you specified for IPv6 packets.
17. -w <wait time>
This option sets the time in seconds to wait for a response to a probe. 5 seconds is the standard wait time.
18. -q <nqueries>
This option sets the number of probe packets per hop. The default value is 3
19. -r
This option bypasses the normal routing tables and sends directly to a host on an attached network. If at all the host is not on a directly available network, an error message is returned.
20. -2 <source address>
This option chooses an alternative source address. By default, the source address is the address of the outgoing interface,
21. -z <send wait>
This option specifies the minimum time interval between probes. The default time interval is 0. If the value entered is more than 10. Then it specifies a number in milliseconds.
22. -e
This option shows the ICMP extensions.
23. -A
This option performs AS path lookups in routing registries and prints results directly after the corresponding addresses
24. -V
This option prints information about the version of the traceroute you are using.
25. –sport=<port>
This option chooses the port to use.
26. –fwmark=<mark>
This option sets the firewall mark for outgoing packets
27. -M <method>
This option uses the method you specified for tracerouting operations.
28. -O <option>
This option specifies some method-specific option. If you wish to enter multiple options, you can do so by separating them with a comma.
29. -U
This option uses UDP to a particular destination port for tracerouting.
30. -D
This option uses a DCCP request for the probes.
31. -P <protocol>
This option uses raw packets of specified protocol tracerouting. The default protocol is taken as 253.
32. –mtu
This option discovers the MTU along the path being traced.
33. –back
This option prints the number of backward hops when it seems different from the forward direction. This number is guessed, assuming that remote hops send reply packets with the initial TTL set to either 64, 128, or 225.
34. -l
This option specifies traceroute to use ICMP echo
PHEW! Those are a hell lot of options! In any case, if you want help regarding the options and information regarding what they do, you can always type the command “traceroute –help” to display the help menu.
Methods available with Linux traceroute command
As we have seen, we can use the option “-M” to specify methods in the traceroute. Let us look at the command available in the traceroute tool.
1. Default
This method used the traditional and ancient method of tracerouting. This method is also allowed for unprivileged users.
2. icmp
This is one of the most commonly used methods. It uses ICMP ECHO packets for probes. If you can ping the host at the destination, ICMP tracerouting is applicable as well.
3. tcpconn
This method is an implementation of the TCP method using a simple connect() call. This connect() call performs a full TCP session opening. This method is is not recommended for normal use. This is so because a destination application is always affected.
4. udp
This option uses a UDP datagram with a constant destination port, whose default value is 53. This method is intended to bypass the firewall as well.
5. udplite
This method uses udplite datagram for probes. This method is also available to unprivileged users
6. dccp
This method uses DCCP Request packets for probes. This method uses the same technique as used for TCP which is the “half-open technique”
7. raw
This method sends a raw packet of protocol proto. No protocol-specified headers are used.
8. tcp
This method is a well-known modern method. It is intended to bypass firewalls and uses the constant destination port, whose default value is 80. This method uses a well-known “half-open-technique”. This technique prevents applications on the destination host from seeing our probes at all.
Let us look at the available options for this method:
a. syn, ack, fin, rst, p. Sh, urg, ece, cwr
These options specify the TCP flags for the probe packets in any combination.
b. Flags = <num>
This option sets the flags field in the TCP header exactly to the number you specify.
c. sack, timestamps, window_scaling
These options use the corresponding TCP header option in the outgoing probe packet.
d. ecn
This option sends SYN packets with TCP flags ECE and CWR.
e. sysctl
This option uses the current sysctl, which is “/proc/sys/net/*” to set for the TCP header options above and ECN, This option is always set as default if nothing else is specified.
f. mss = <num>
This option uses the value of the number you specify for maxseg TCP header option.
g. info
This option prints TCP flags of final TCP replies when the target host id is reached. It also allows you to determine whether an application listens to the poet and other useful things.
Now that you know how to install traceroute, the syntax, the different options and methods available with the traceroute command, let us now see some practical examples by putting the options we discussed above into use
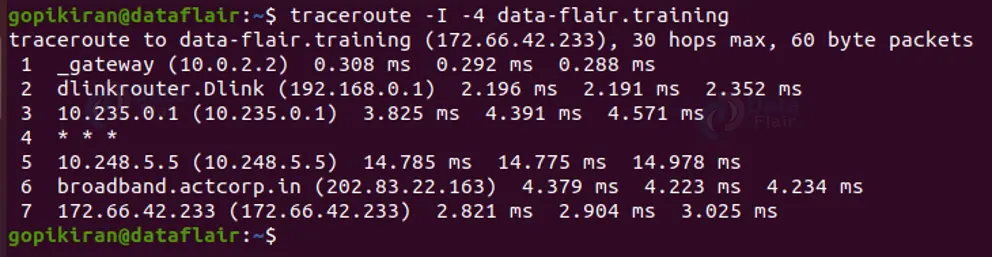
Tracerouting using IPv4
You can trace the route to a host network using the Ipv4 protocol by using the option “-4”
Tracerouting using IPv6
Similarly, to trace the route to a host network using the Ipv6 protocol by using the option “-6”
Disabling hostname mapping
If you don’t want the names of the host, you can hide them by using the option “n”
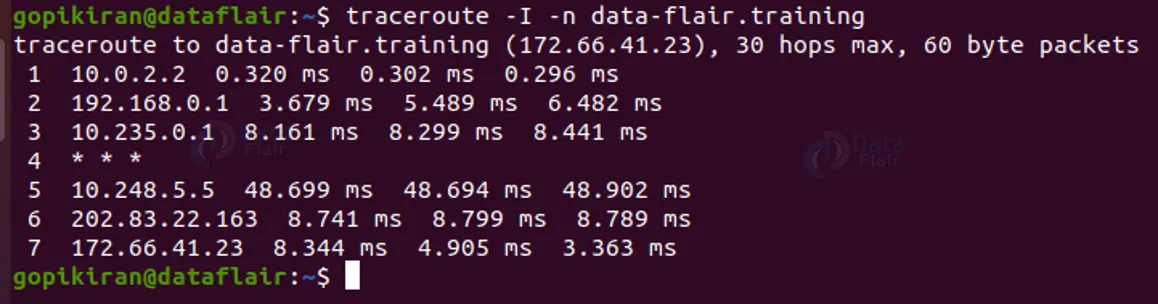
If you notice carefully the names of nighter mine nor the host’s router name appeared.
Setting the number of queries per hop
To set the number of queries per hop, use the option “-q” followed by the number of queries you want to specify.
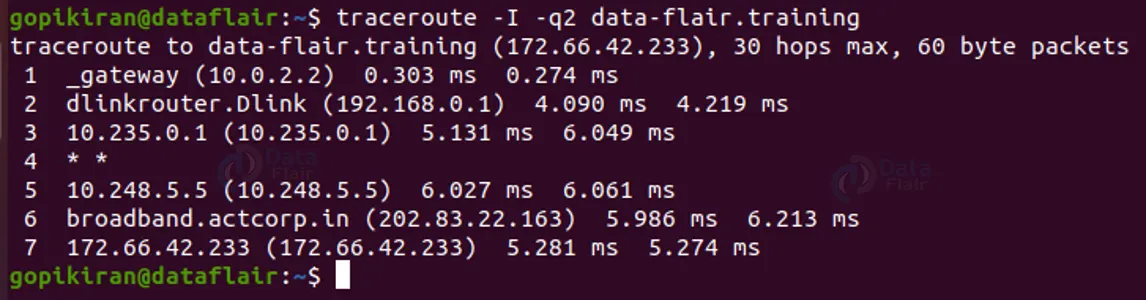
If you note the above output, you can see only 2 probes were sent instead of 3 which is the default number of probes.
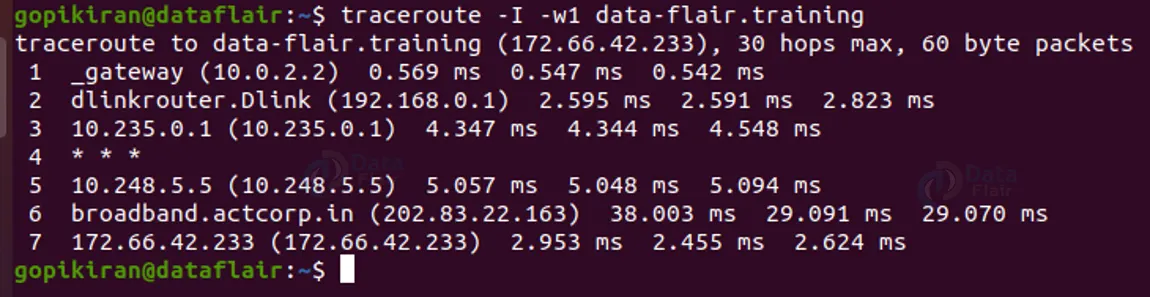
Setting response wait time
If you want to specify the wait time in seconds for responding to a probe, you can use the “w” option followed by the time in seconds.
Specifying the interface to use
To set a specific interface that traceroute should use, use the option “i” followed by the interface you want the traceroute to use.
For example, the command “traceroute -I -i wlp3s0b1 data-flair.training” will traceroute “data-flair.training” using the interface “wlp3s0b1 ”
Setting the initial TTL values
To set the initial TTL value, use the option “-f” followed by the number you want to specify.
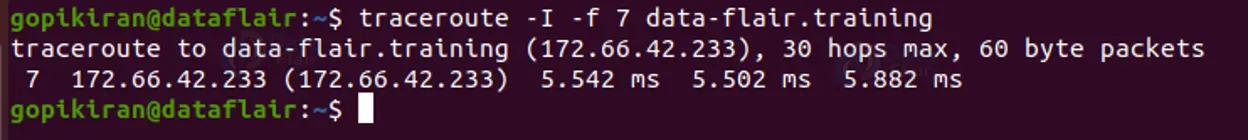
In the above output the traceroute jumped straight to the 7th hop and skipped the rest.
Setting the maximum number of hops
To set the maximum number of hops, you can use the option “-m” followed by the number you want to specify.
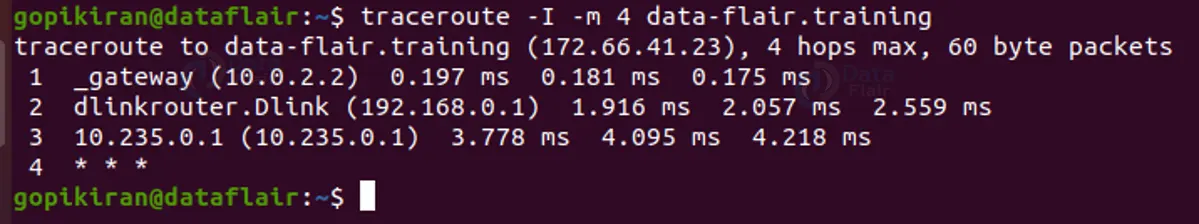
In the above output, the tracerouting happens only till 4 hops.
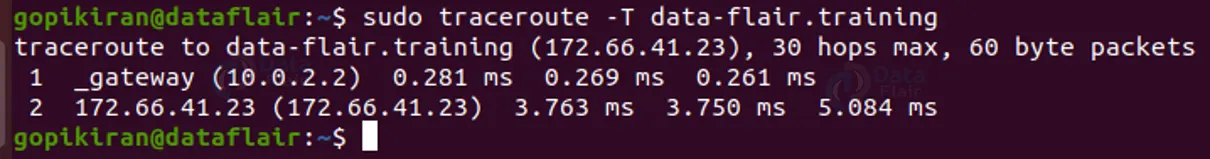
Using the TCP method
To use the TCP method in trace routing, simply use the option “-T”
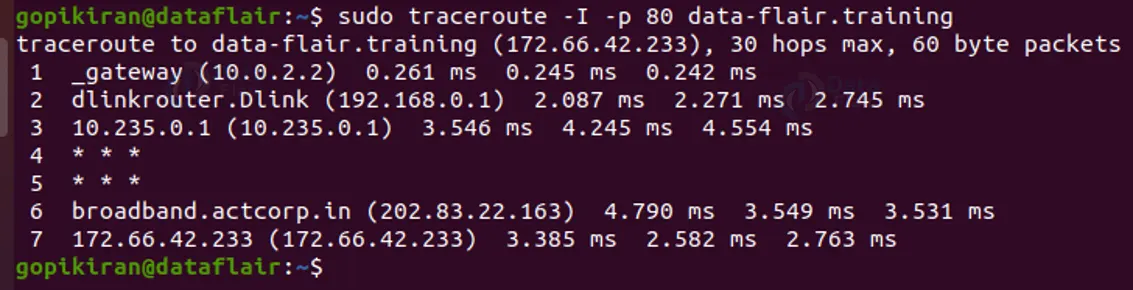
Testing ports
If you need to test a specific port, you can specify the port using the option “-p”
Specifying the packet length
If you want to specify the packet size in bytes, you can simply specify the number of bytes at the very end of the command.
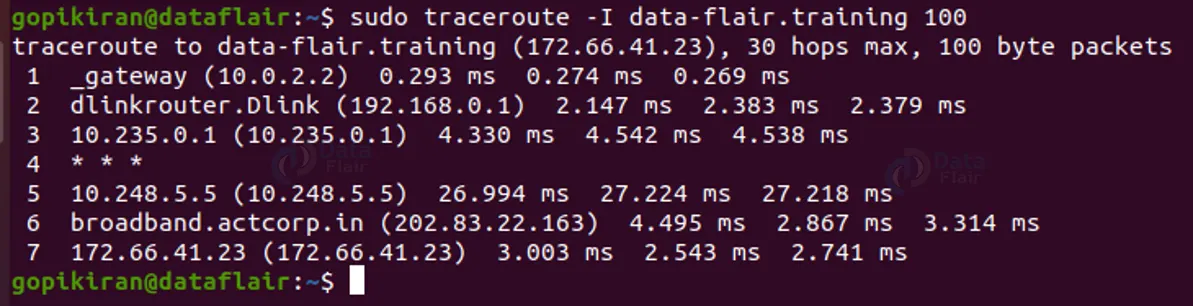
If you compare the above output with any other output in this article you will find that the max packet size is now 100 bytes instead of 60 bytes, which is the default value.
Seeking help while using Linux Traceroute Command
If at all you get stuck anywhere, you can either type the command “traceroute –help” or “man traceroute” for the full manual about the traceroute command.
Summary
Now you have learned what traceroute is, the uses of traceroute, and most importantly, how traceroute works. You have also learned the different commands for installing the traceroute command on different Linux distros. We have also seen the syntax, options, methods, and many practical examples of the traceroute command.
Your opinion matters
Please write your valuable feedback about DataFlair on Google


