Top Command in Linux
Job-ready Online Courses: Dive into Knowledge. Learn More!
In this article, we will learn everything about the top command in Linux. First, we will look at the top command and its uses and understand the output of the top command as we take a closer look at the fields in the output, the syntax of the top command, and the options used along with it.
In the end, we will also look at some crazy practical examples of the top command by pairing it with various options to understand its working. So pay attention, take notes, and read to the end for the best benefits.
What is top command in Linux?
Top is the abbreviation for Table Of Processes, a command-line-based utility in Linux-based operating systems displaying information about the processes in the system. This command is a boon for system administrators as it provides a dynamic real-time view of the running system.
The top command shows a gist of the system and the list of processes or threads which the Linux Kernel currently manages. It also shows you other information like CPU utilisation, memory utilisation, user name, process ID, and much more (we will look at it when we understand the top command output).
Syntax of Linux top command
The syntax of the top command is shown below:
top <options>
Options used with top command in Linux
We can combine the top command with a range of options that specify how the top command must function, format, and print the output. We can pair the top command with multiple options too! Let us take a brief look at each of the options available with the top command:
1. -b
This option starts the top command in batch mode. In this mode, you can send output from top to other programs or a file.
2. -c
This option starts the top command with the last remembered ‘c’ state reversed.
3. -d
This option specifies the delay between screen updates and overrides the corresponding value in one’s personal configuration file.
4. -h
This option displays individual threads. Without this option, the top command displays the summation of all threads in each process.

5. -n
This option specifies the maximum number of iterations or frames the top command should produce.
6. -p
This option monitor and prints the information of the processes which have the PIDs you specified.
7. -s
This option starts the top command in secure mode. This option is applicable even for the root user.
8. -S
This option starts the top command with the last remembered ‘S’ state reversed. In this cumulative time mode, the tip command lists each process along with the CPU time that the process and its dead children have used.
9. -u
This option displays the process that matches the uid or username you specified—this enmeshed user-filter mode.
10. -v
This option displays information about the version of the top command you are using in your operating system.
Understanding the output of the top command
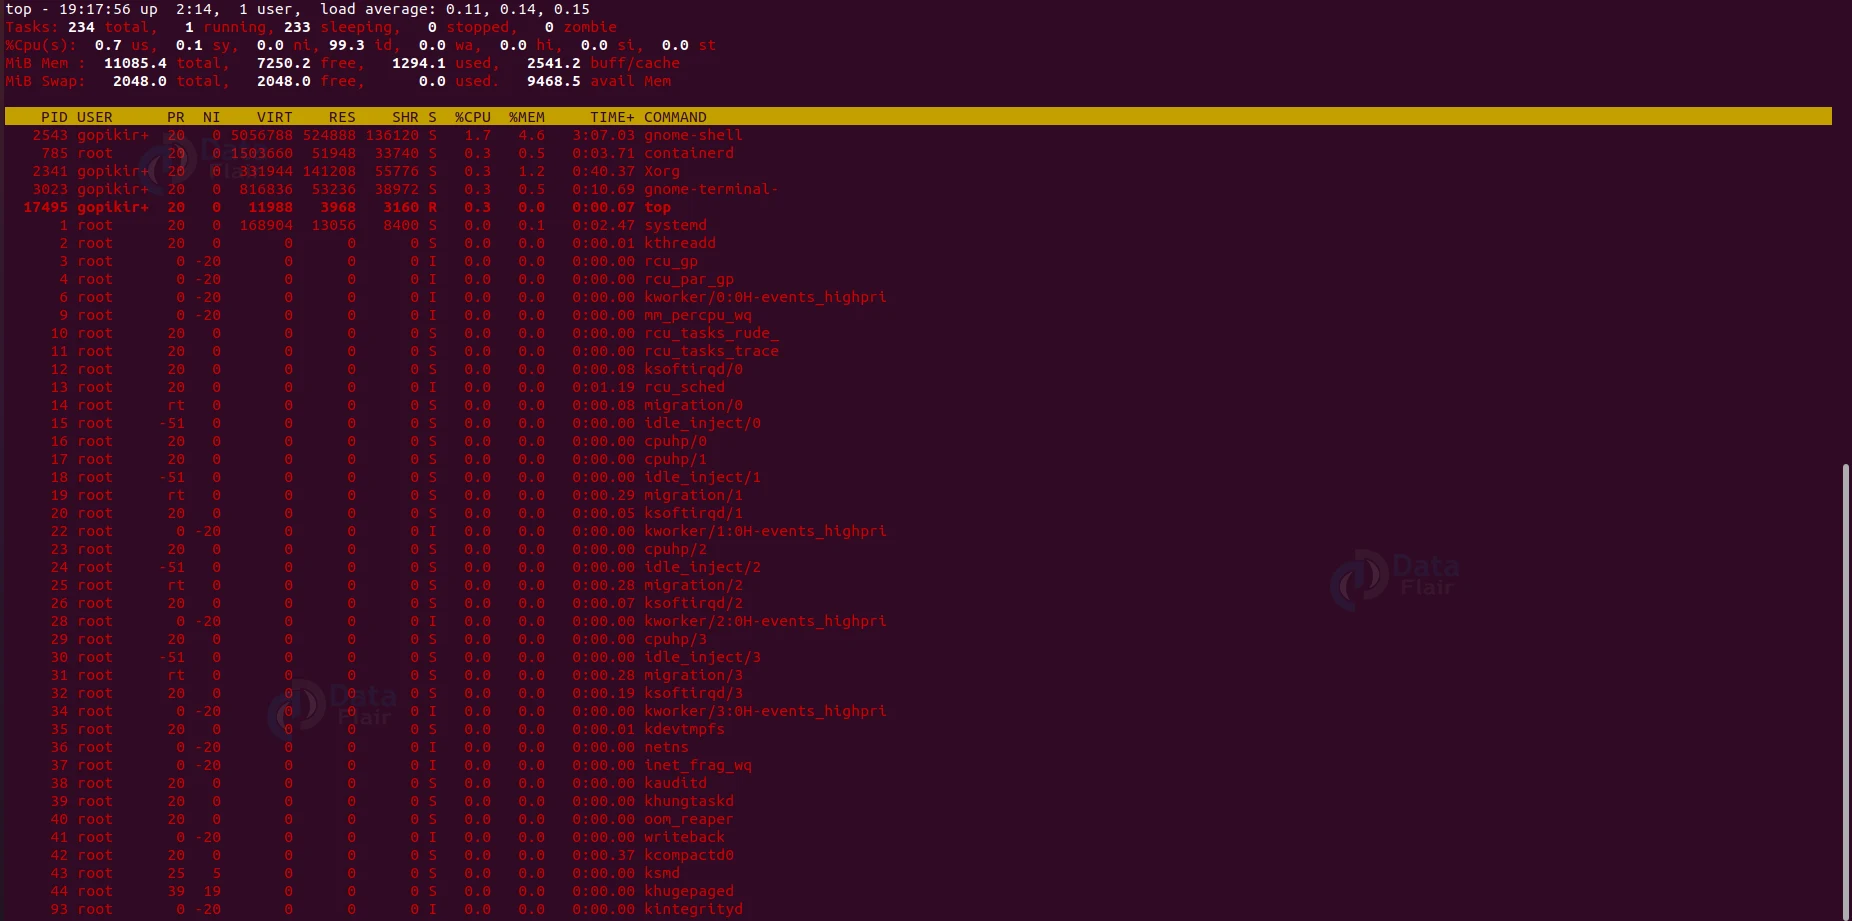
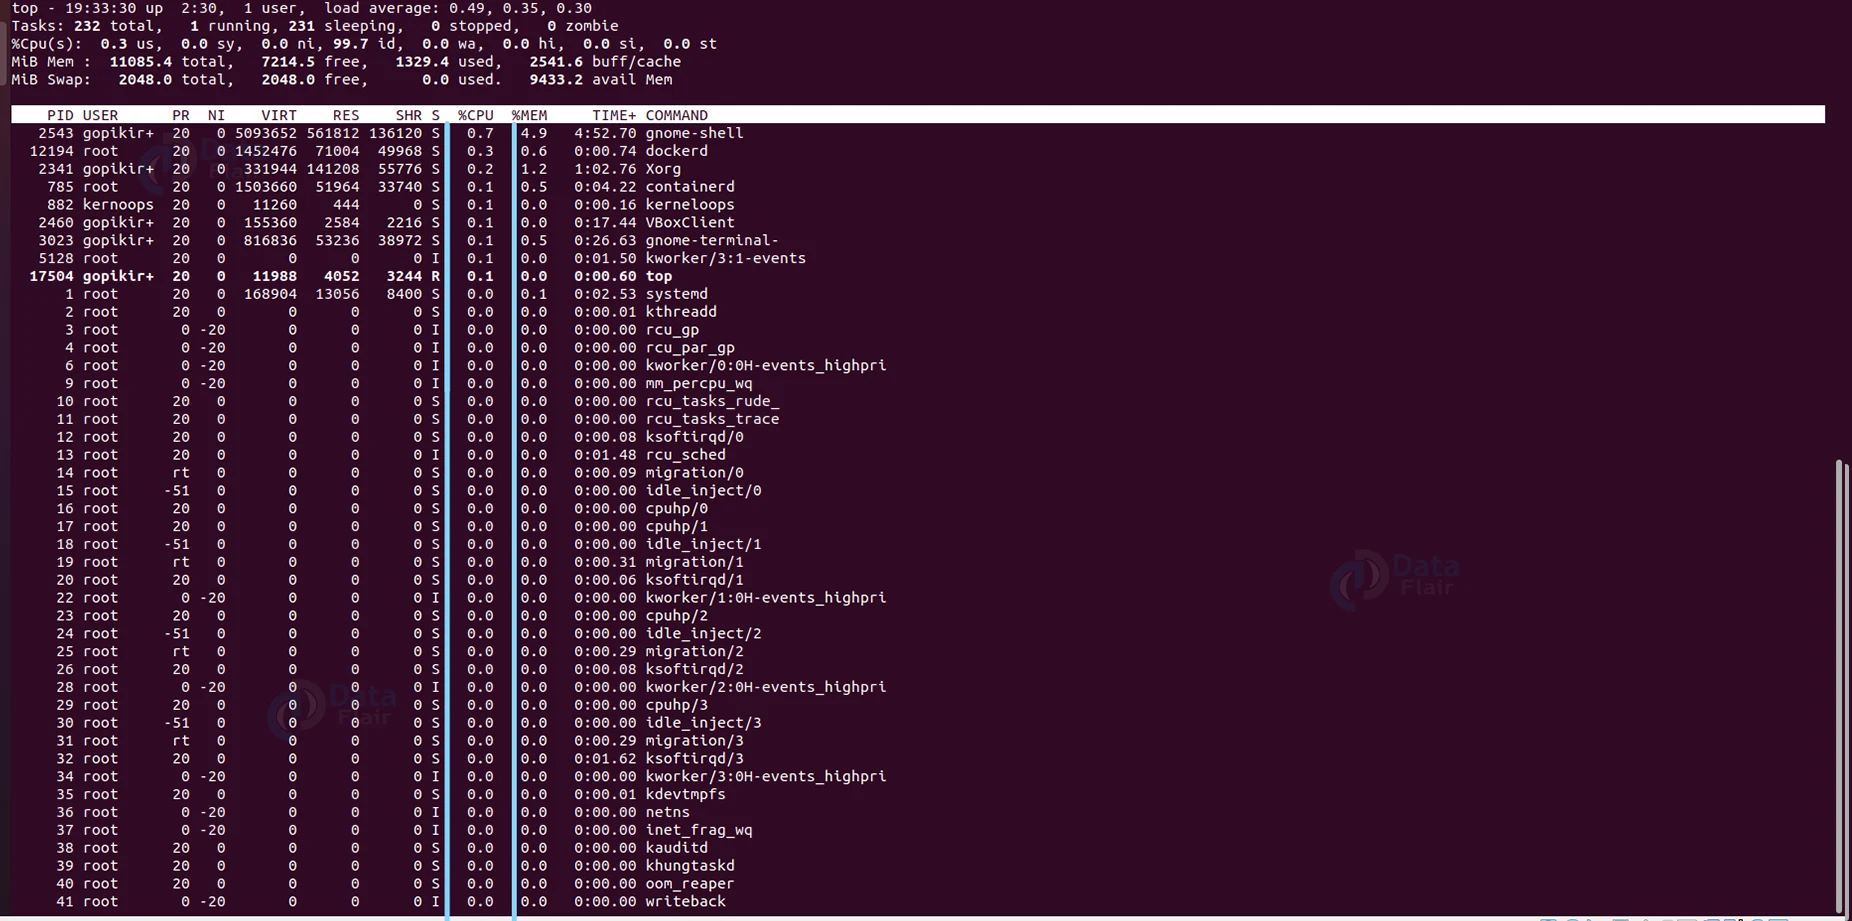
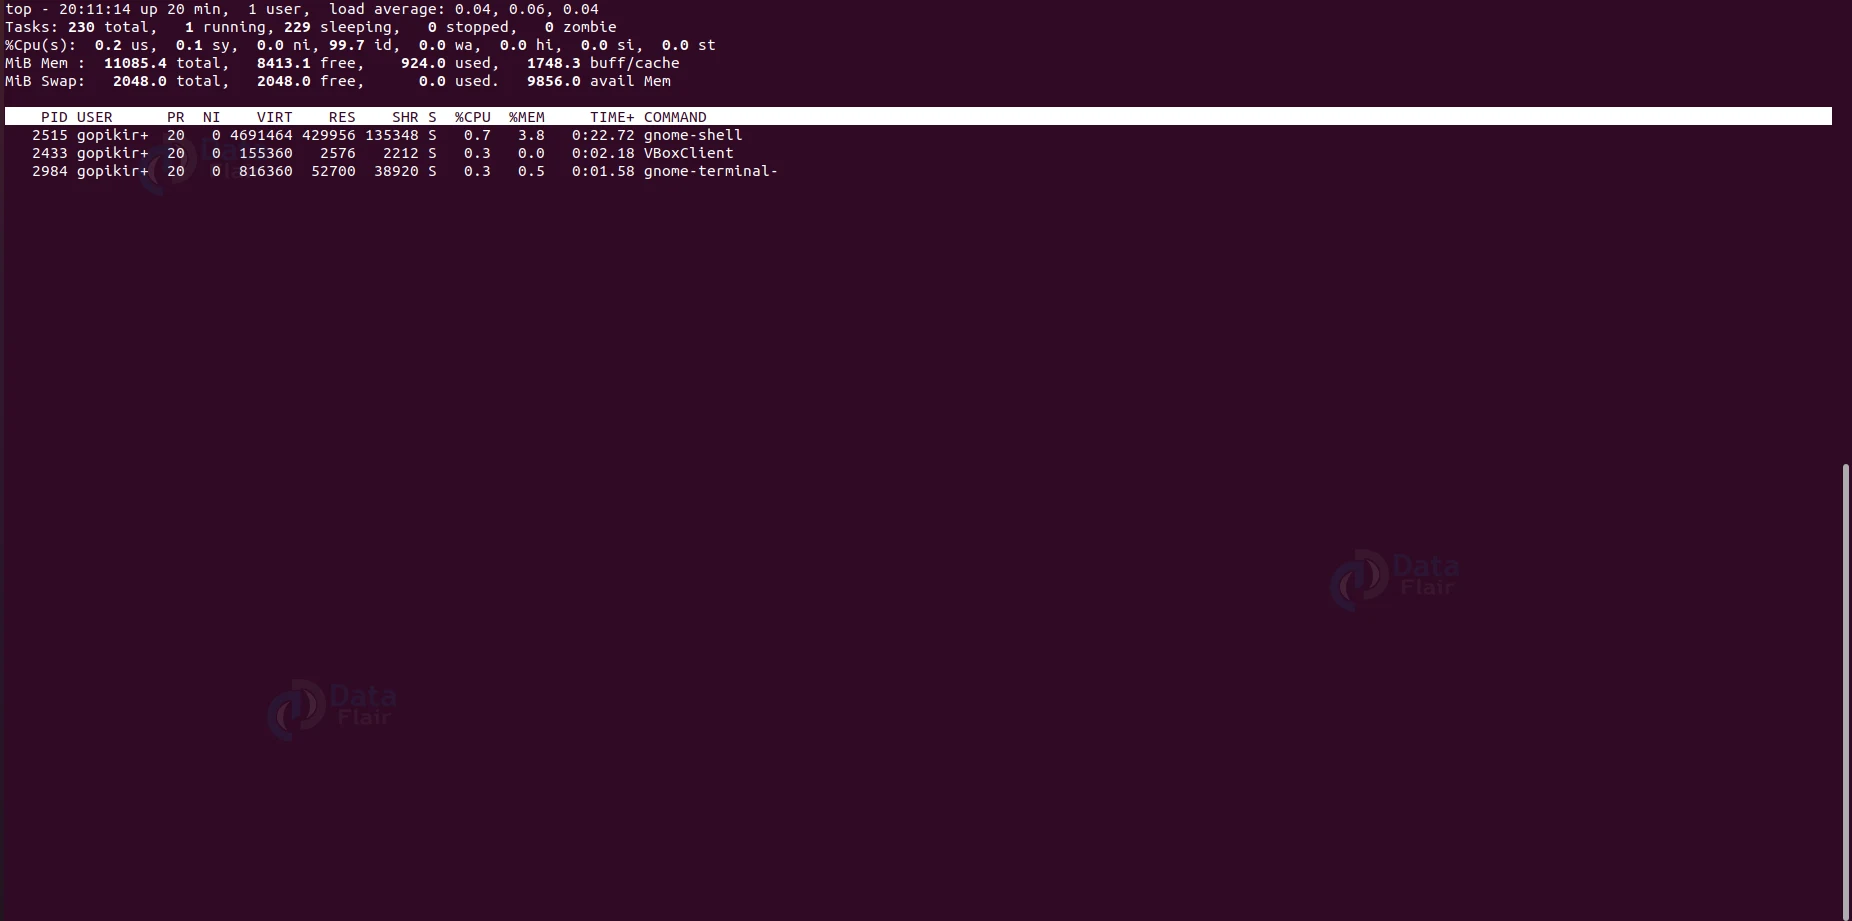
When we use the top command without any options, it prints the output shown below:
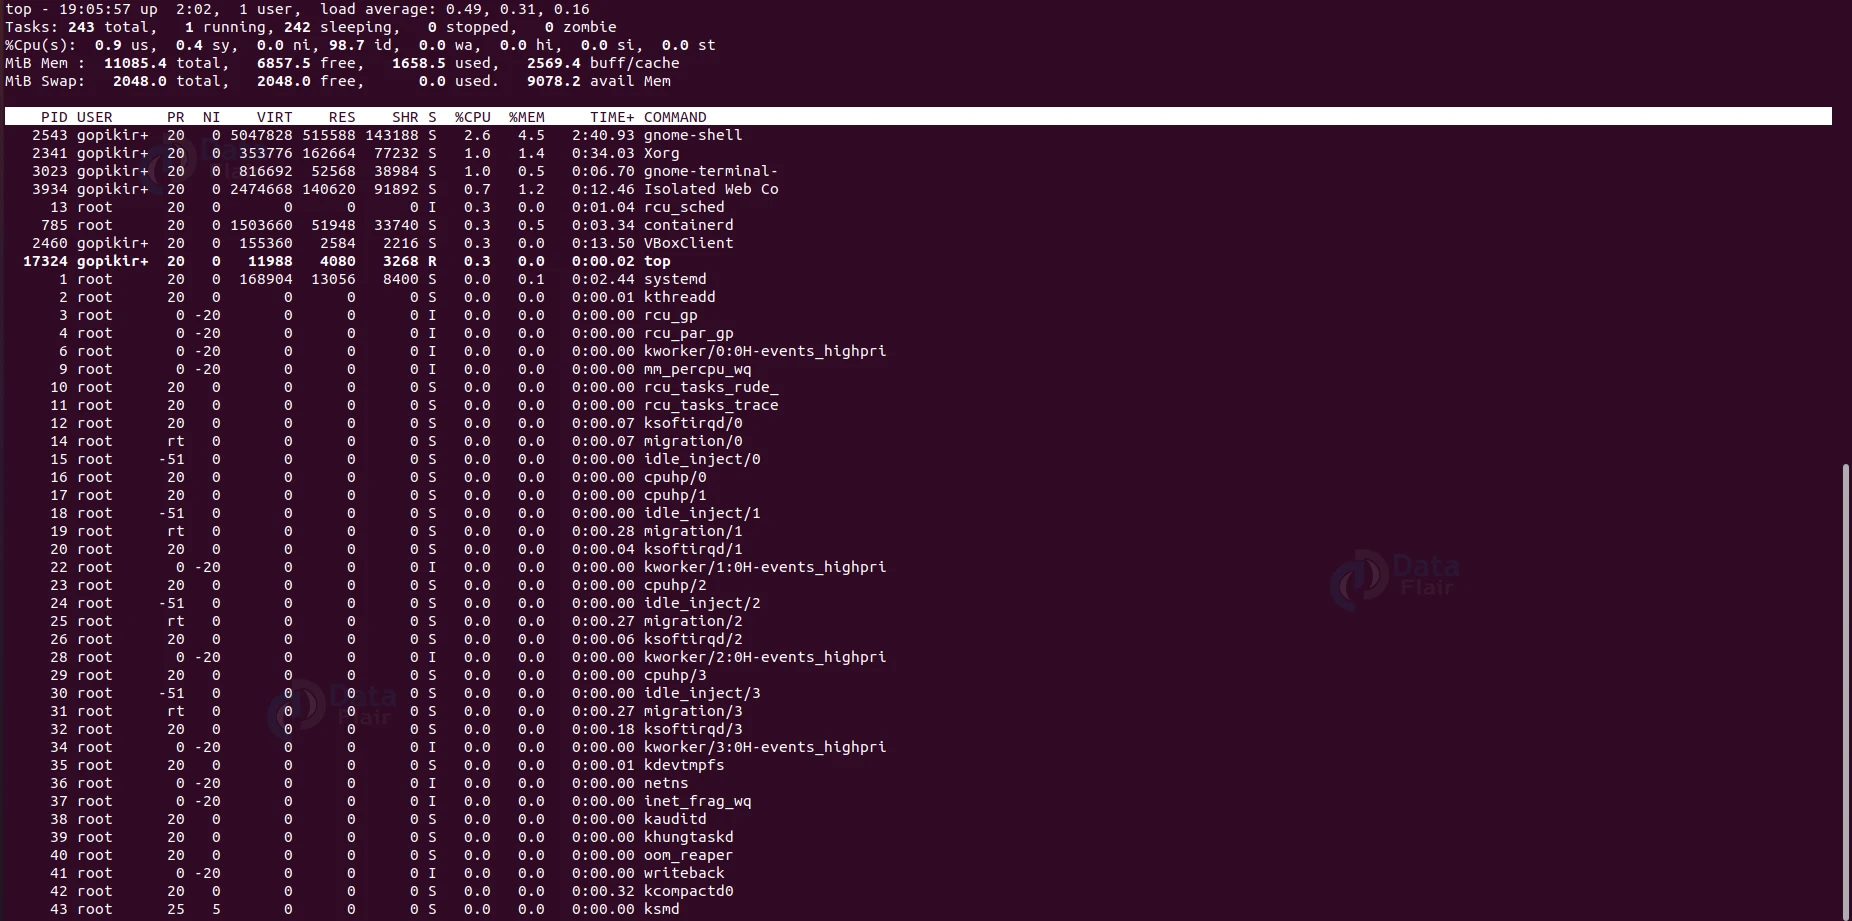
The output shown above contains a lot of valuable information regarding processes. Now let us look closely at each column’s name and the information they show.
1. PID – It shows the process identification number.
2. USER – It shows the user’s name running the process.
3. PR – It shows the scheduling priority for the process.
4. NI – It shows the nice value of the process,
5. VIRT – It shows the virtual memory amount used by the process.
6. ES – It shows the resident’s (physical) memory amount used by the process.
7. RHR – It shows the total shared memory used by the process.
8. S – The status of the process – R means running, and S means sleeping.
9. %CPU – It shows the percentage of CPU usage.
10. %MEM – It shows the memory usage percentage.
11. TIME+ – It shows the total CPU usage amount.
12. COMMAND – It shows the command’s name that started the process.
Now that we have covered the basics and the theoretical part of the top command, let us understand how the top command and its options work by looking at some practical examples in the terminal of Ubuntu 20.04.
Sorting processes based on PID
Once you have executed the top command, press the “m” and “t” keys to sort the processes shown on the screen based on their process identification number.
Sorting processes based on memory utilization
If you want to sort the processes based on the memory utilization, press the “m” and “p” keys in the interactive mode of the top command.
Sorting processes based on run time
Use the keys “m” and “t” in the interactive mode of the top command to sort the processes with respect to their run times.
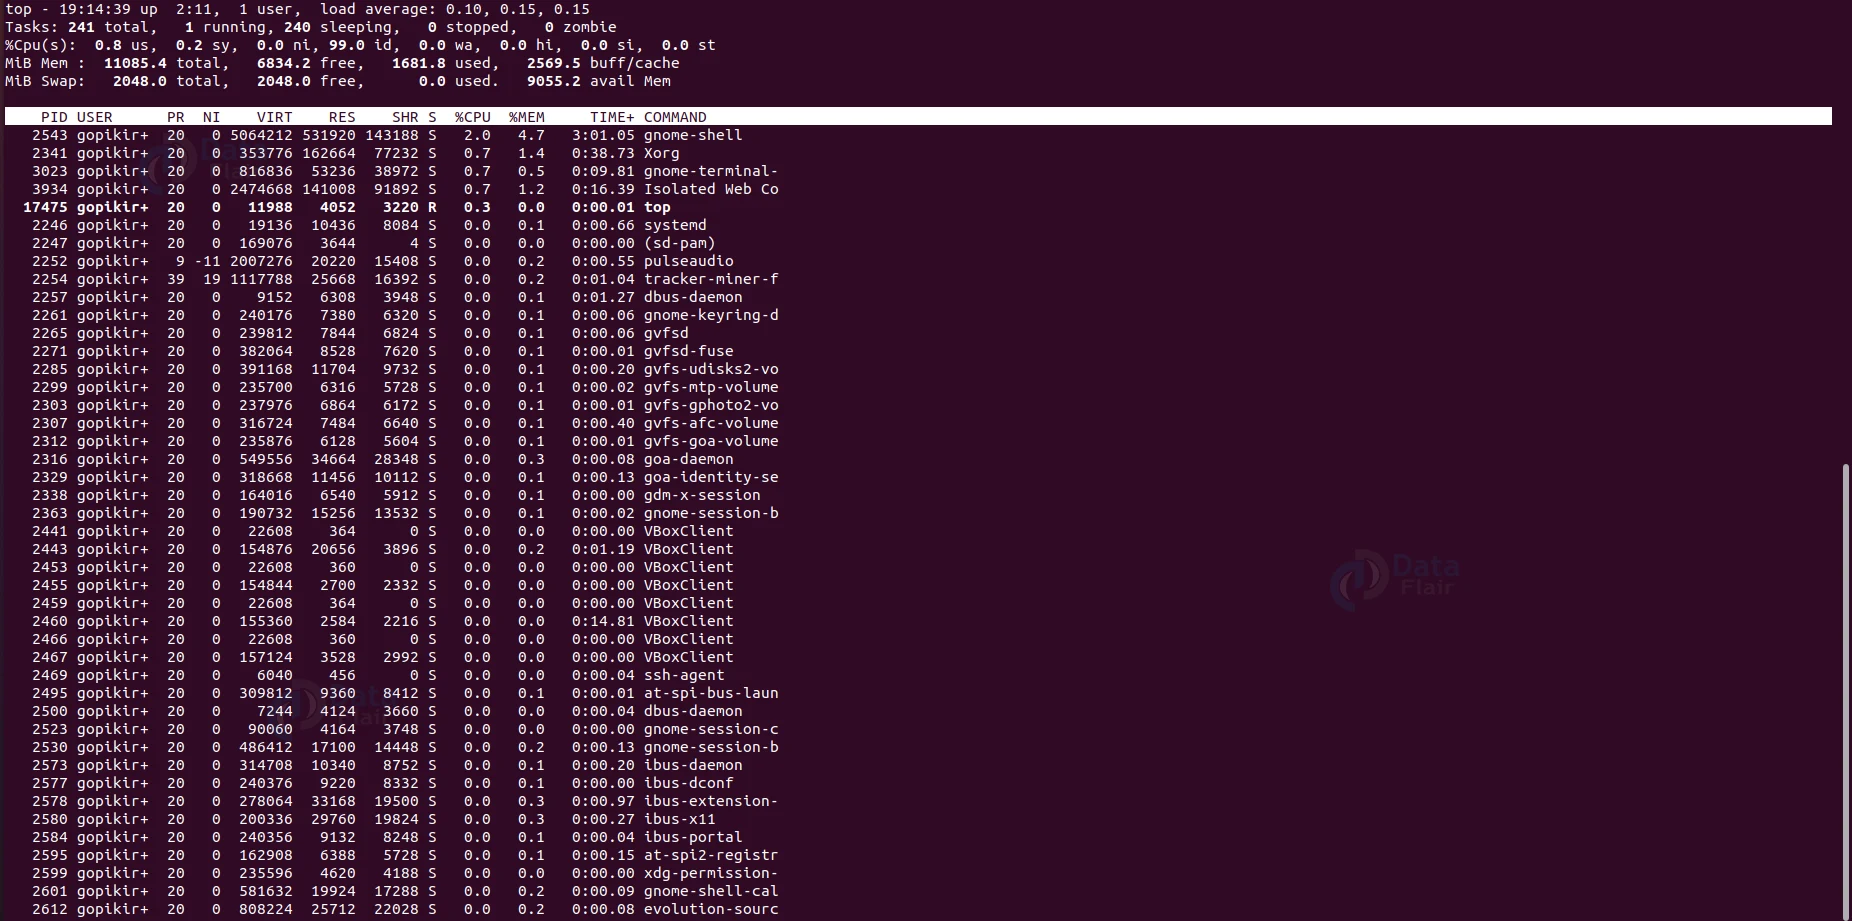
Displaying processes based on user
If you want to display information based on user-specific processes, combine the top command with the option “-u” followed by the username.
Highlighting the running processes
If you want to improve readability and change the colour of the running processes to red, you must press the “z” key in the interactive mode of the top command.
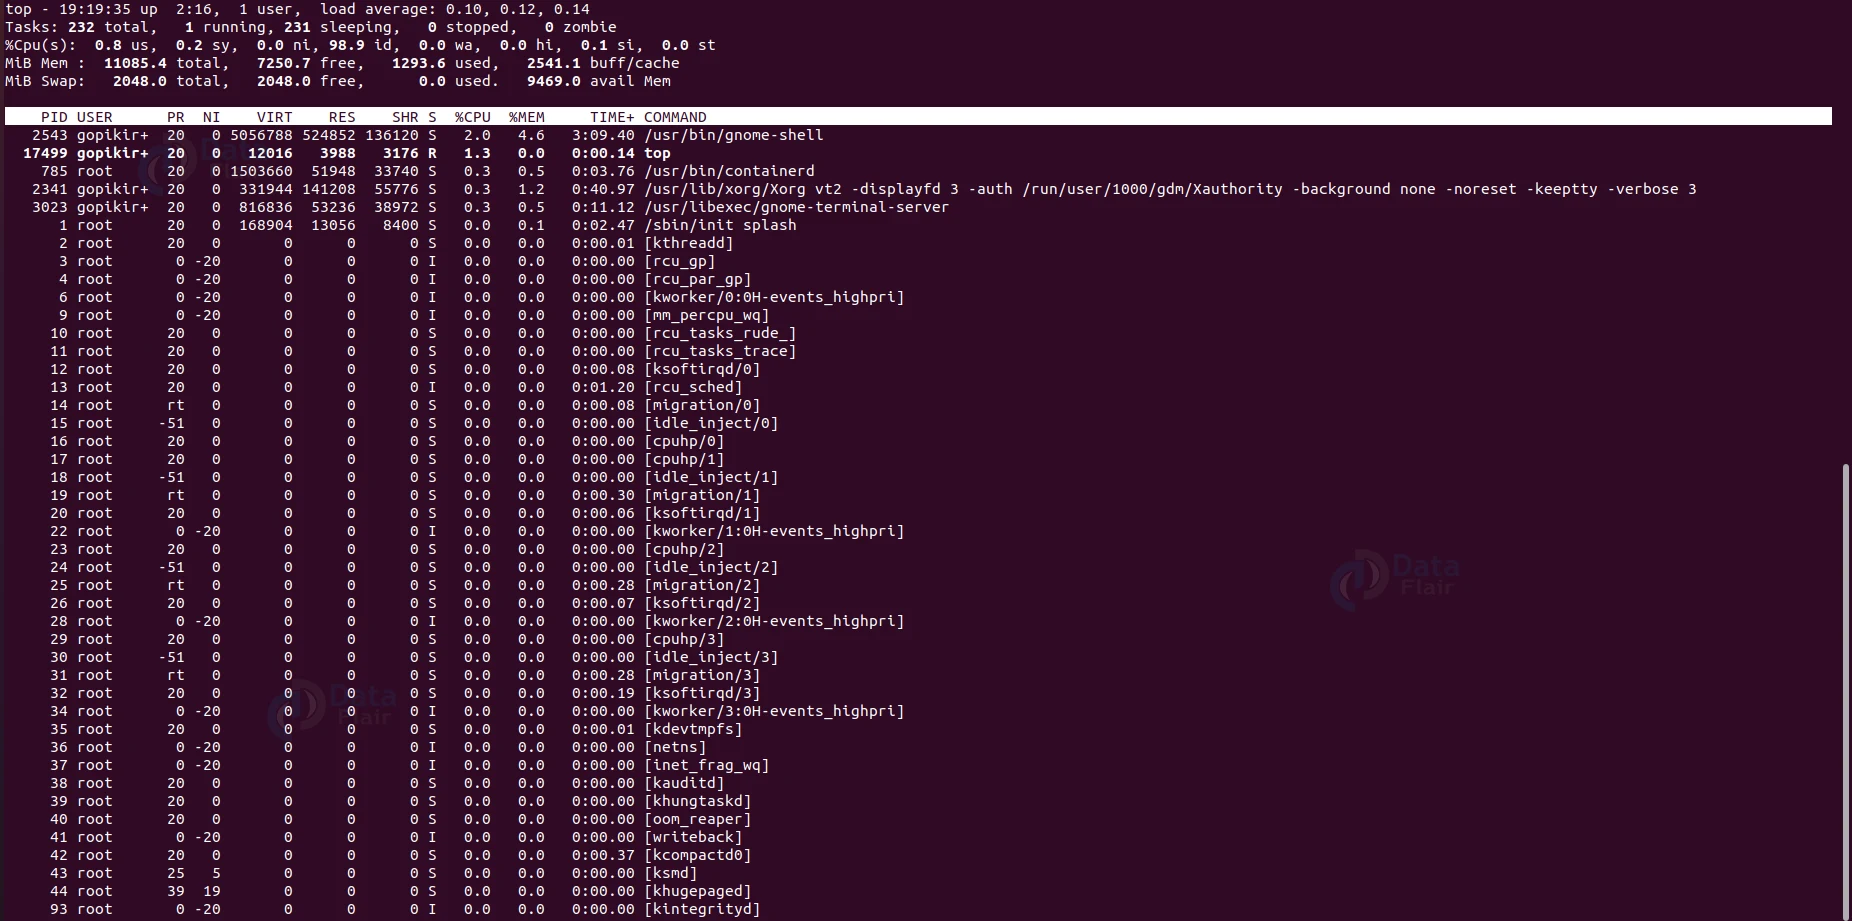
Listing the absolute path of processes
If you want to display the absolute path of the processes that are running, press the “c” key in the interactive mode of the top command.
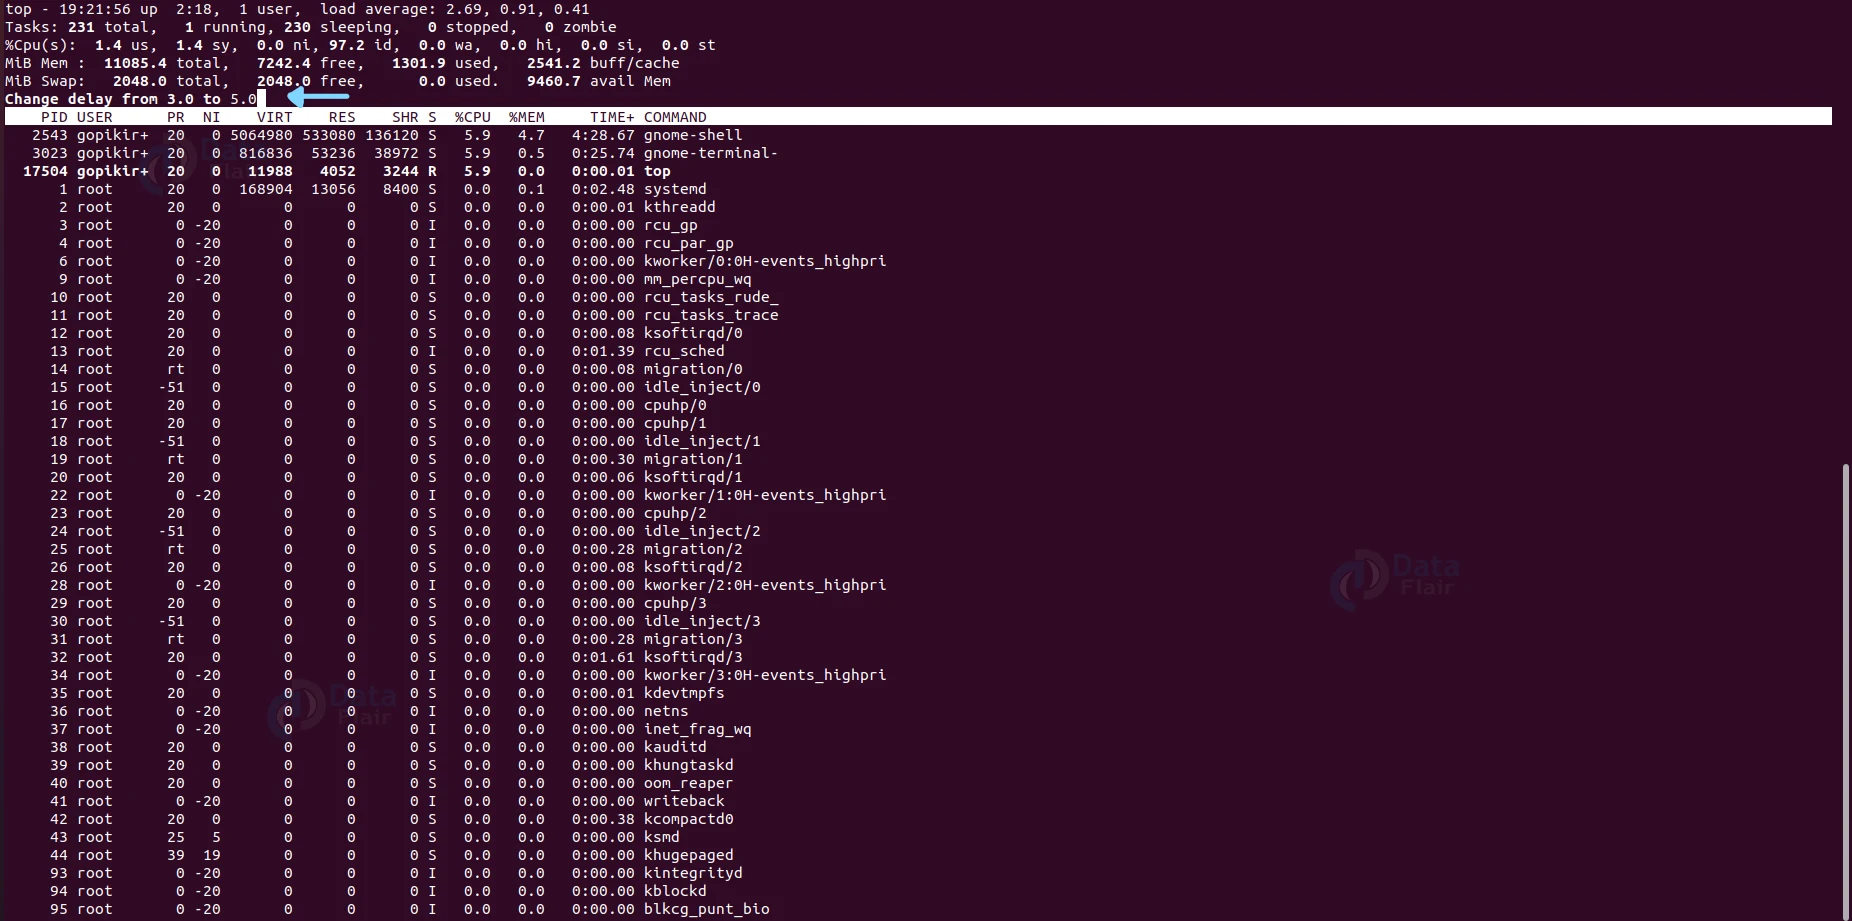
Setting a refresh interval in Linux
The default setting of the top command is to refresh the screen every 3 seconds. Nonetheless, if you want to set the number of seconds after which the screen must refresh, you can press the key “d” in the interactive mode of the top command.
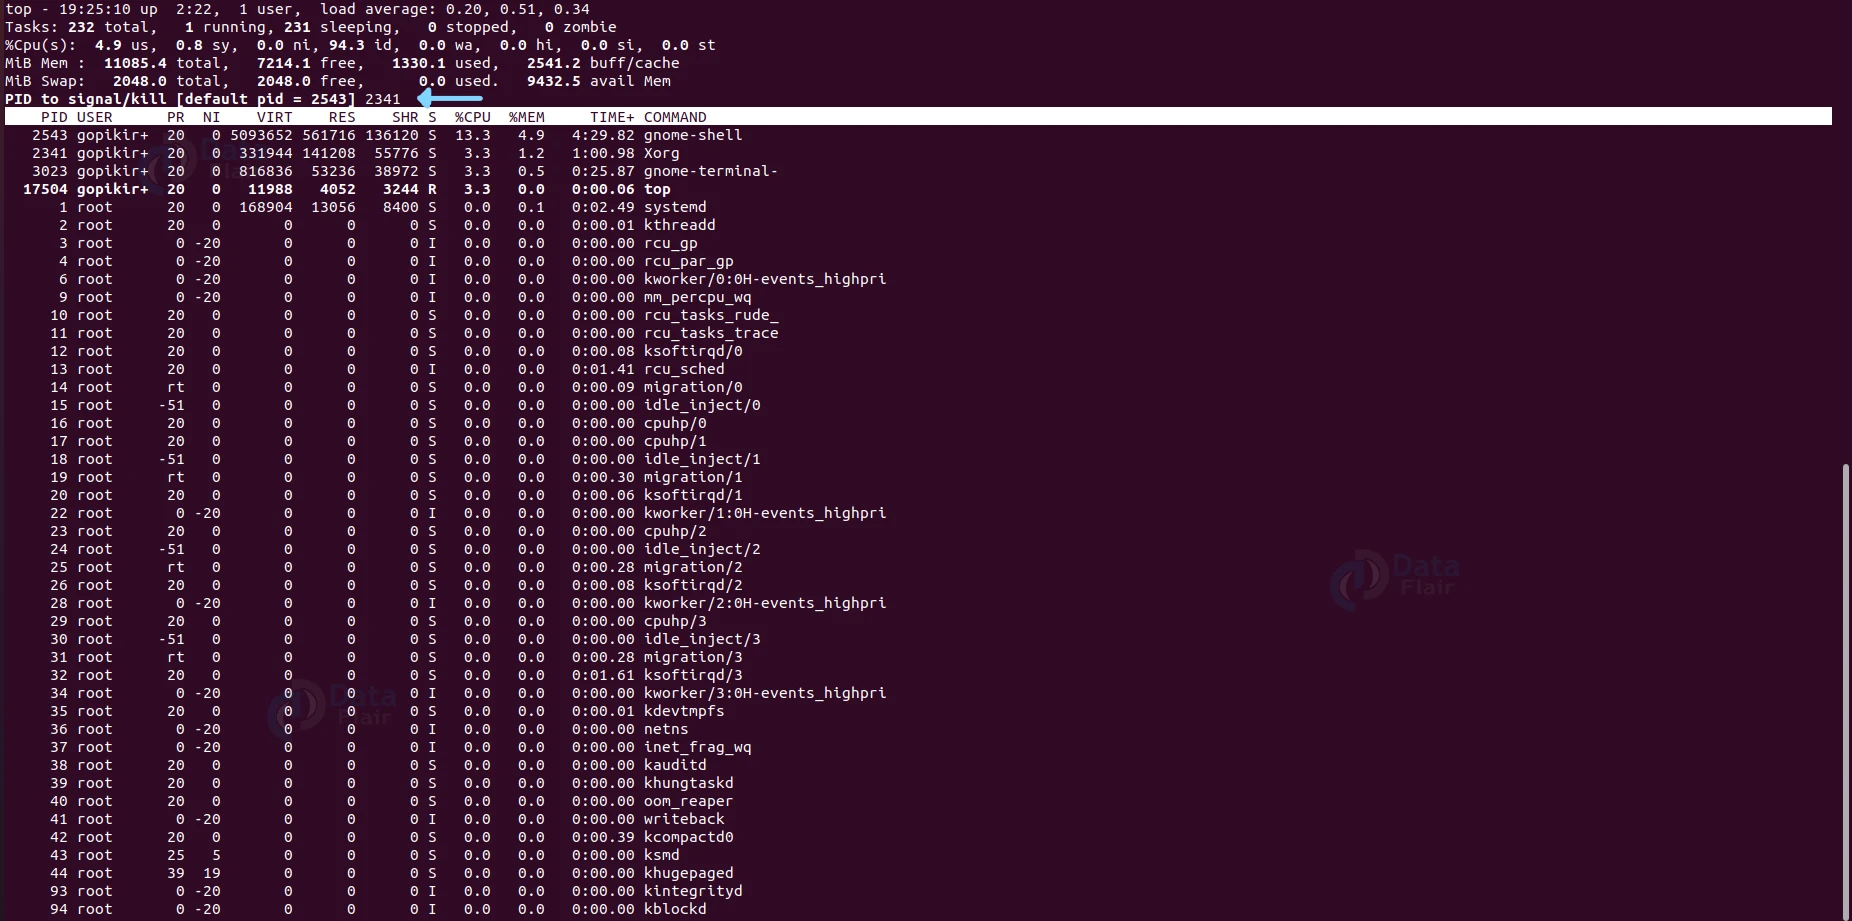
Killing a process in Linux
If you want to kill a process, use the key “k” followed by the PID of the process you wish to terminate in the interactive mode of the top command.
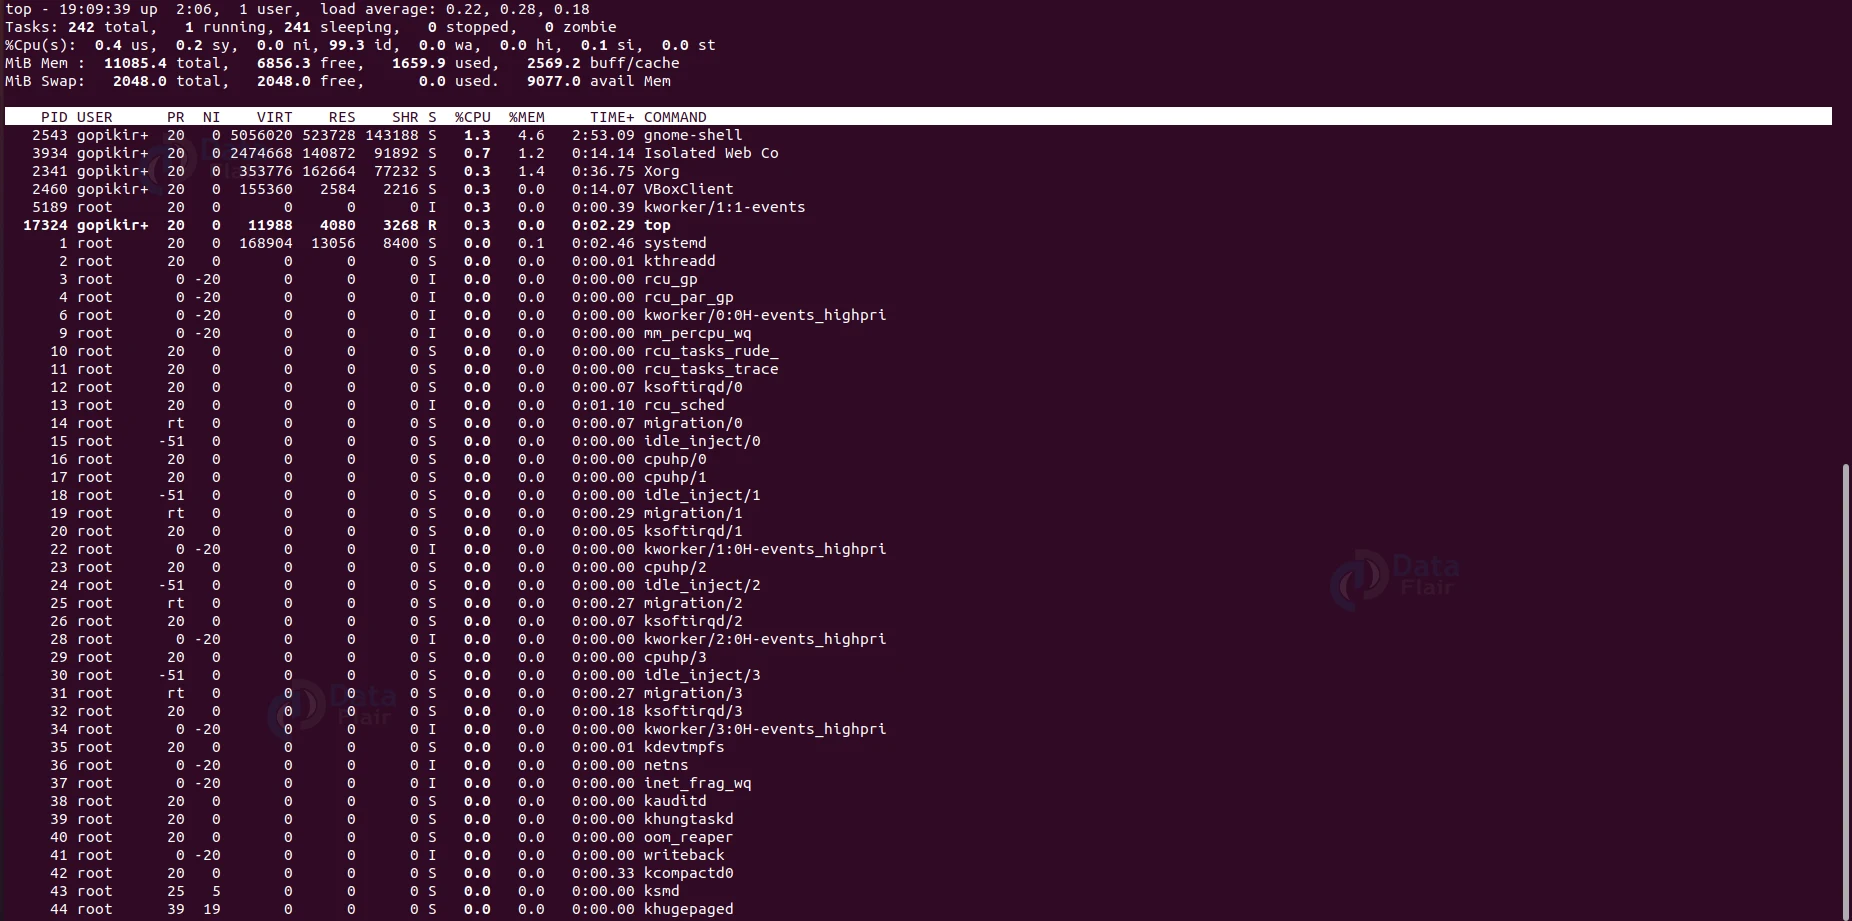
Sorting processes based on CPU utilisation
If you want to sort all of the running processes with respect to their CPU utilisation, press the key combination “shift” + “p” in the interactive mode of the top command.
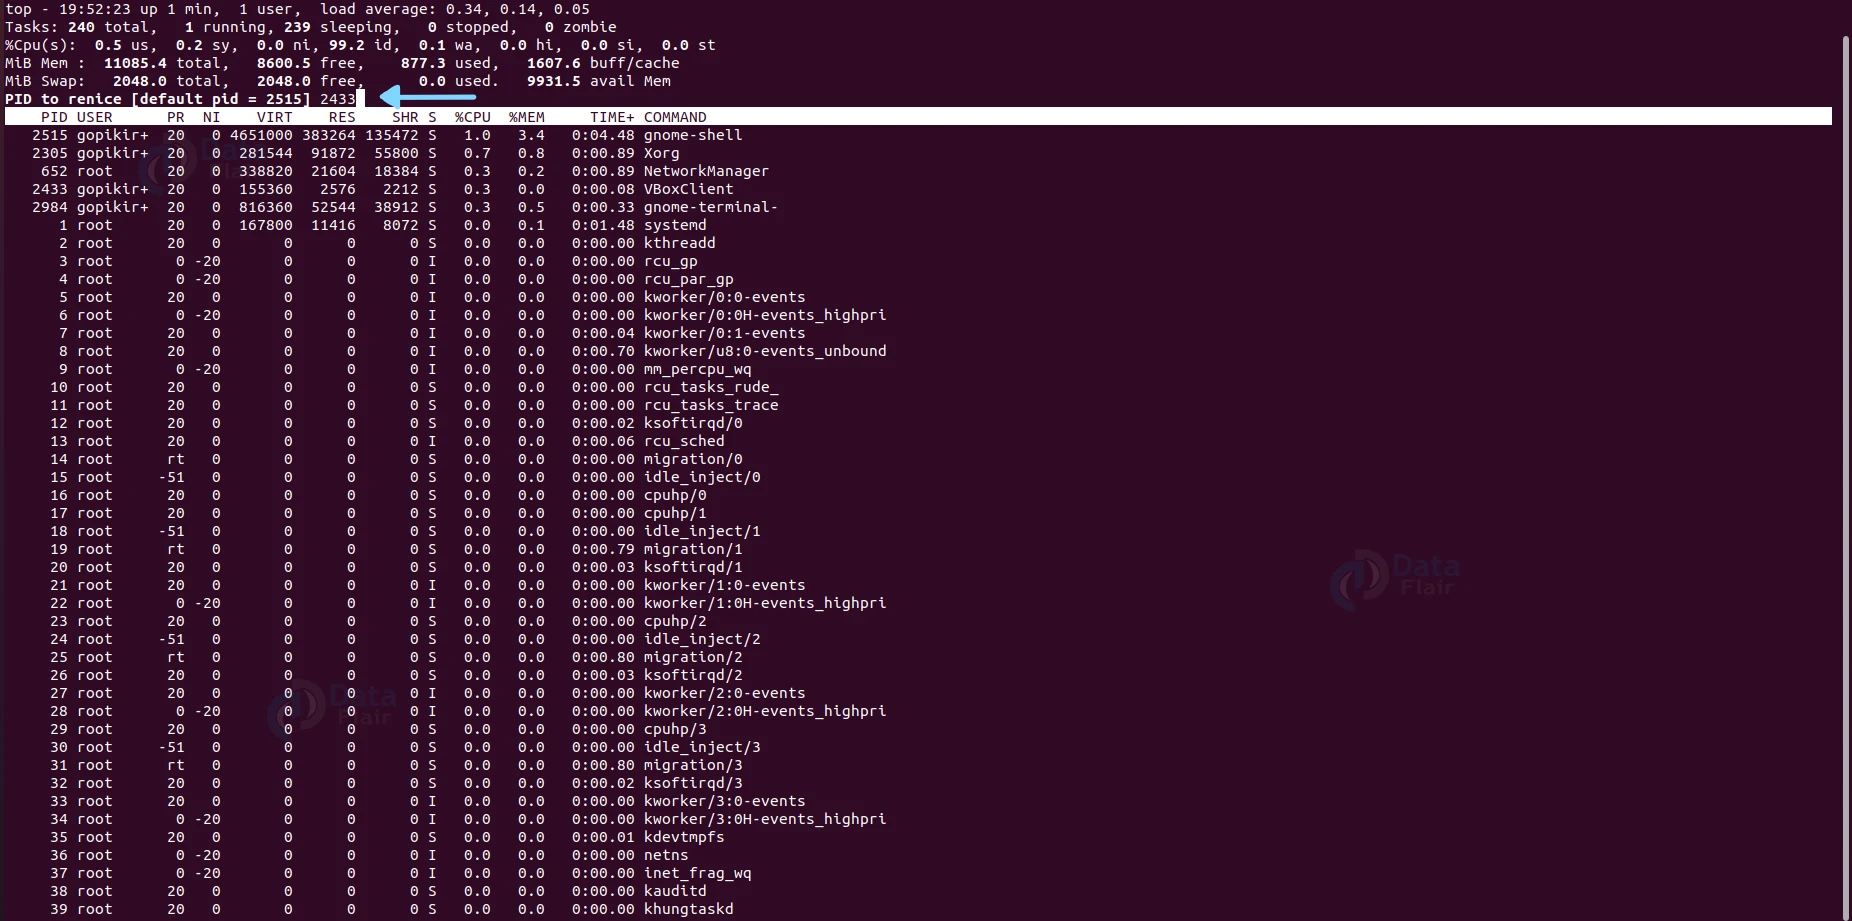
Changing the priority of a process
If you want to change the priority of a process, you can press the option “r” after executing the top command. The process of changing the priority of a process is also called renice.
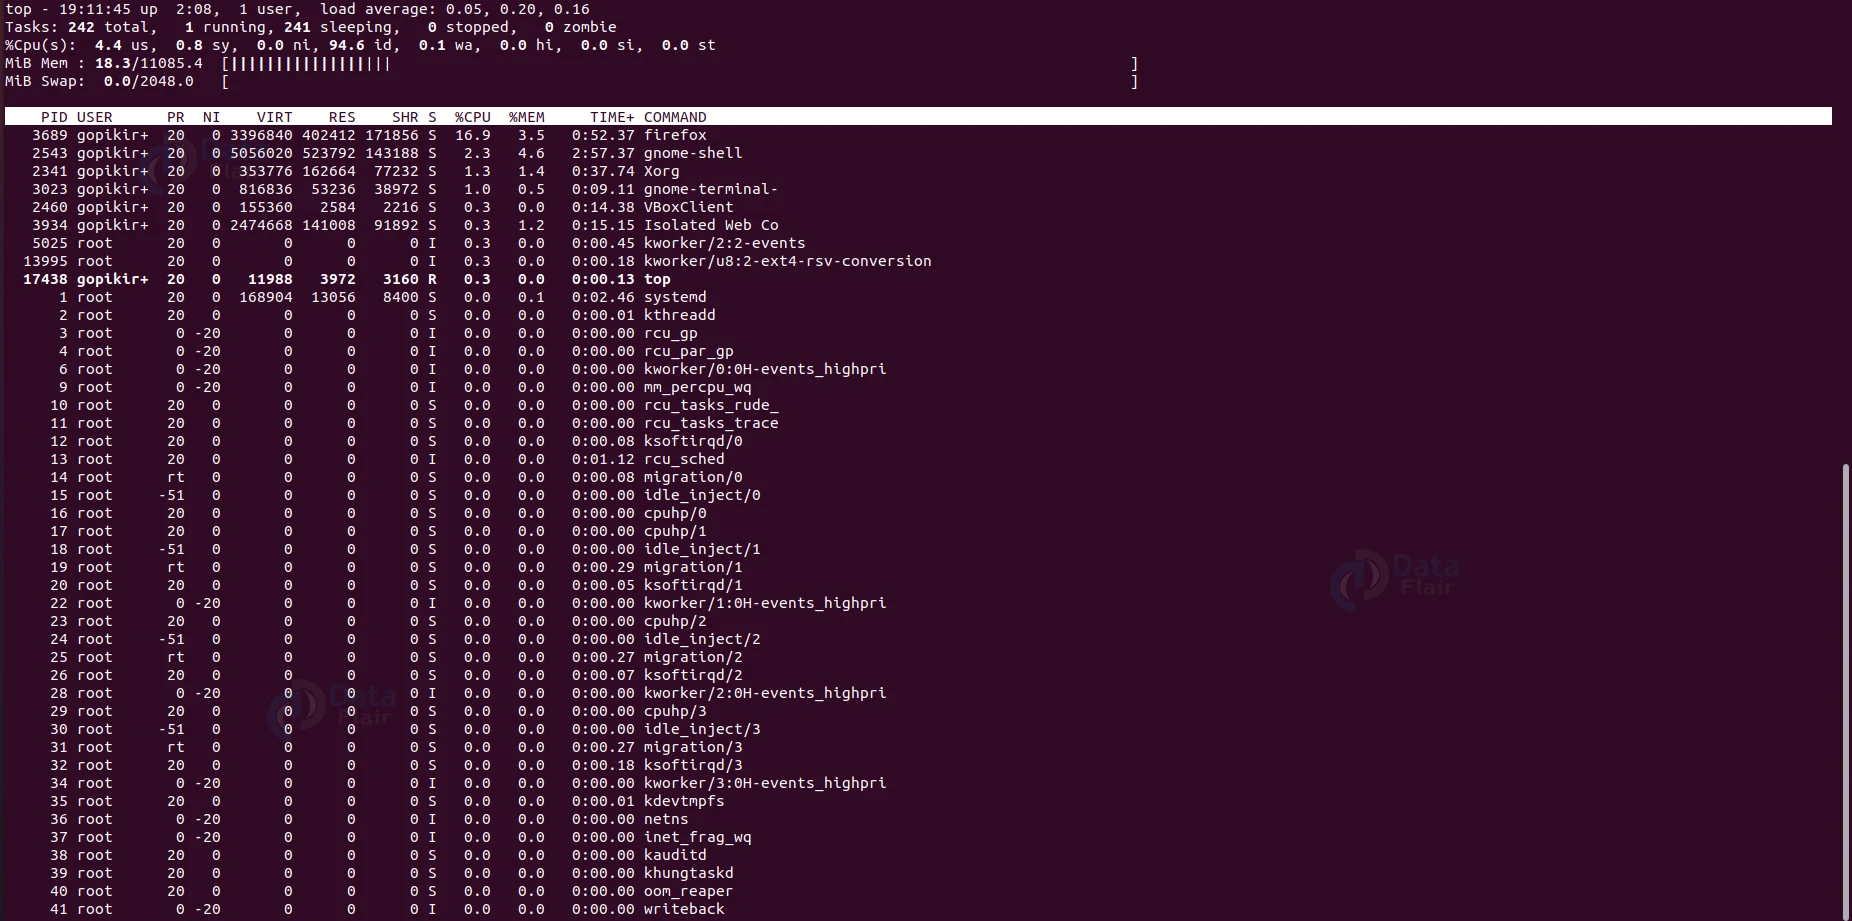
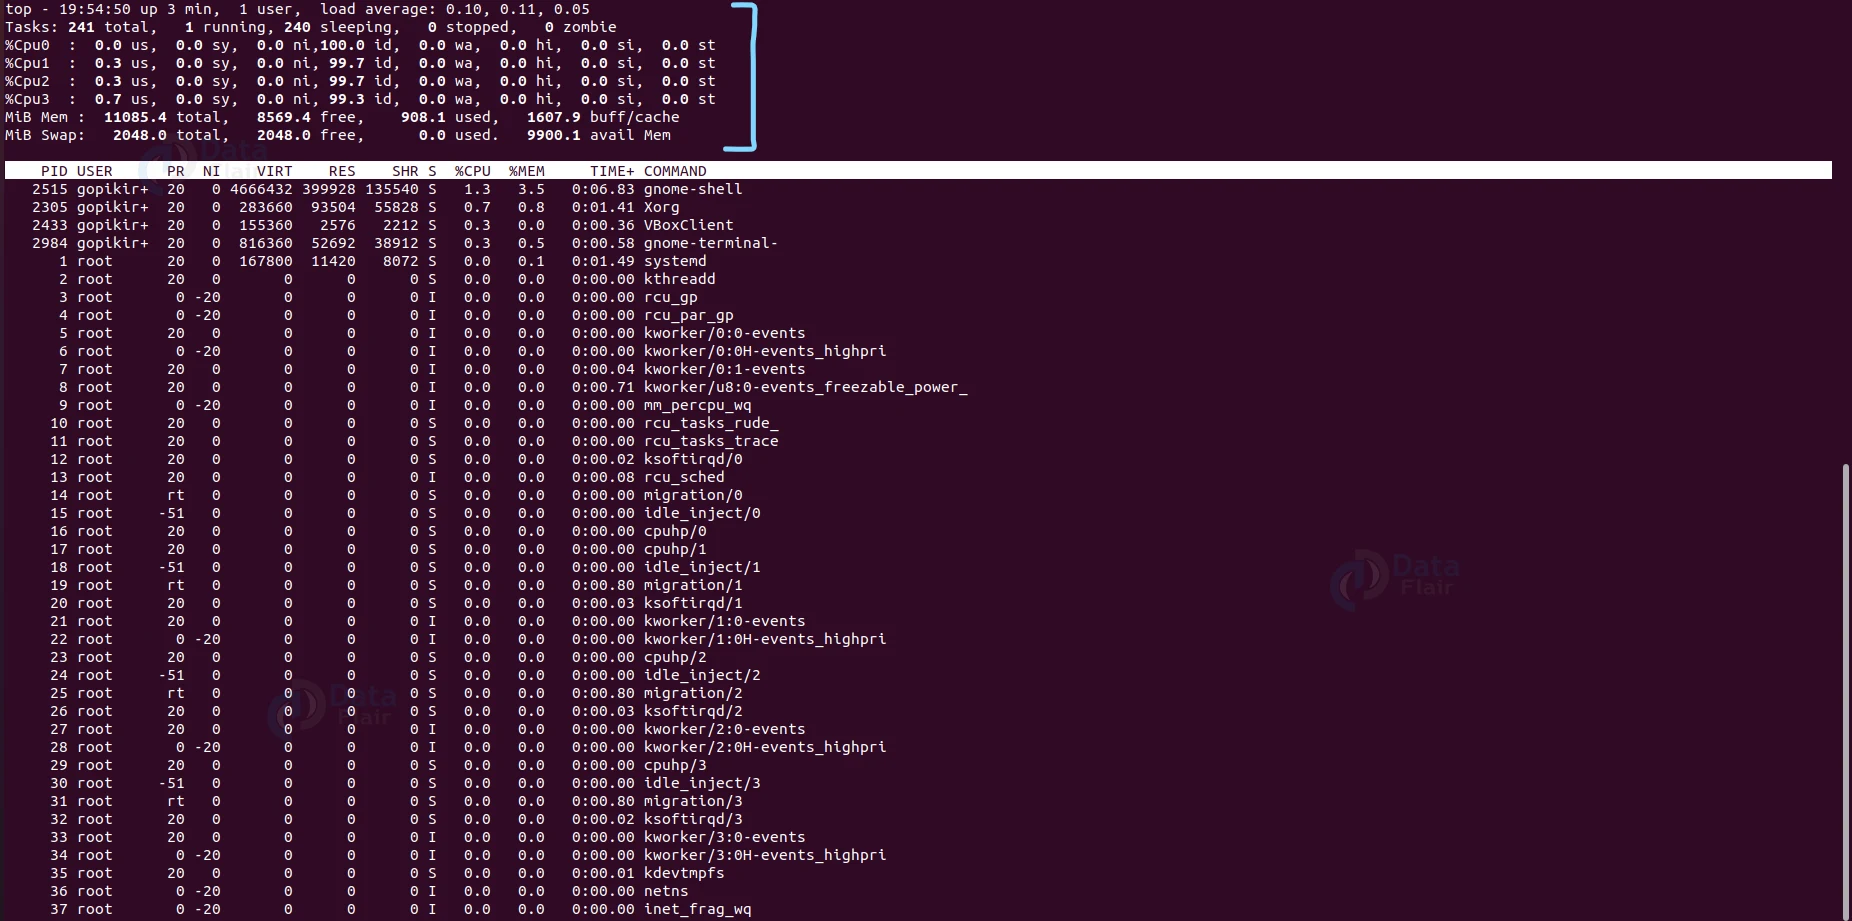
Displaying CPU cores
If you want to check your information on the load on your CPU, you can ask the top command to print the CPU core information by pressing “1.”
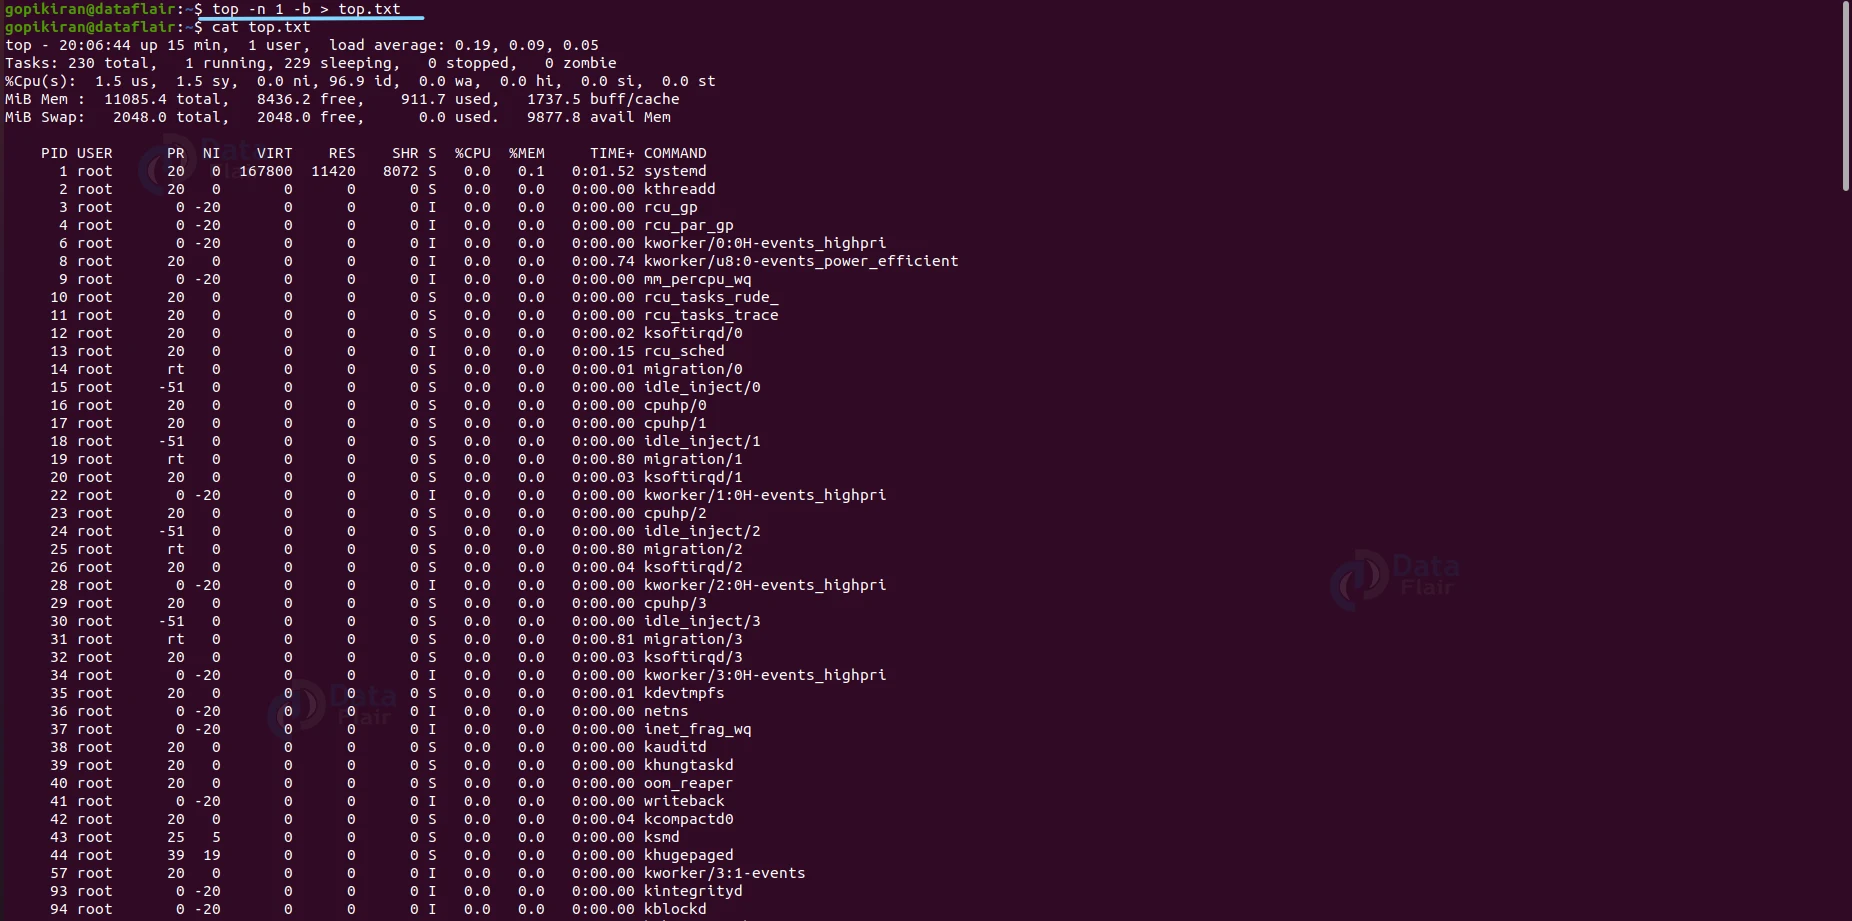
Saving the top command result in a file
If you want to save the top command’s output in a file to check later, pair the top command with the option “-b” followed by the name of the file you want to save the output in. Use the following syntax: top -b <filename>.
Listing idle processes
If you want to list all idle or sleeping processes, type the key “i” after executing the top command.
Exiting the top command after a specific repetition
If you want to exit the top command automatically after a few specific repetitions, run the top command with the option “-n” followed by the number of repetitions as shown:
top -n <number>
Summary
As you have seen, the top command is a simple tool that prints valuable real-time information on your system’s process. You have now understood the top command as we discussed what it is used for, the syntax of the top command, the options used along with it, and the output of the top command. We have also seen many practical examples of the top command, like sorting, procuring other valuable information, and more.
Did you like our efforts? If Yes, please give DataFlair 5 Stars on Google


