Pyspark Profiler – Methods and Functions
In our last article, we discussed PySpark MLlib – Algorithms and Parameters. Today, in this article, we will see PySpark Profiler. Moreover, we will discuss PySpark Profiler functions.
Basically, to ensure that the applications do not waste any resources, we want to profile their threads to try and spot any problematic code.
So, let’s start PySpark Profiler.
What is Pyspark Profiler?
In PySpark, custom profilers are supported. The reason behind using custom profilers is to allow different profilers to be used. Also, to do outputting to different formats rather than what is offered in the BasicProfiler.
However, here are some methods which a custom profiler has to define or inherit:
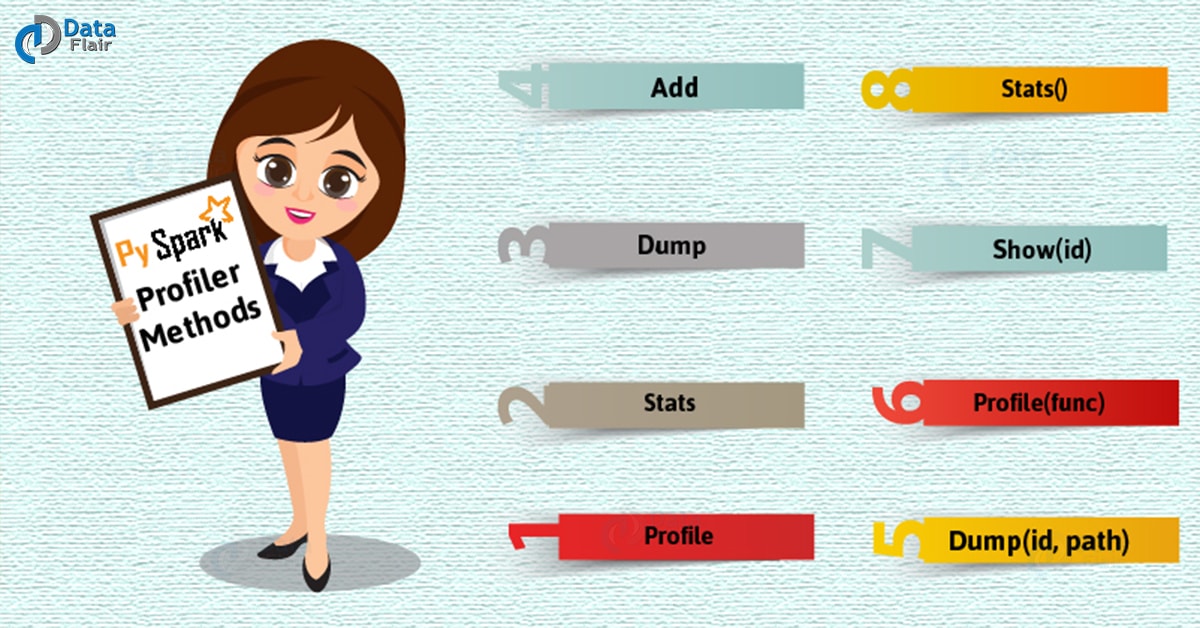
Methods and Functions in PySpark Profilers
i. Profile
Basically, it produces a system profile of some sort.
ii. Stats
This method returns the collected stats.
iii. Dump
It dumps the profiles to a path
iv. Add
Well, this method adds a profile to the existing accumulated profile.
Make sure, at the time of creating a SparkContext, the profiler class is chosen.
>>> from pyspark import SparkConf, SparkContext
>>> from pyspark import BasicProfiler
>>> class MyCustomProfiler(BasicProfiler):
...     def show(self, id):
...         print("My custom profiles for RDD:%s" % id)
...
>>> conf = SparkConf().set("spark.python.profile", "true")
>>> sc = SparkContext('local', 'test', conf=conf, profiler_cls=MyCustomProfiler)
>>> sc.parallelize(range(1000)).map(lambda x: 2 * x).take(10)
[0, 2, 4, 6, 8, 10, 12, 14, 16, 18]
>>> sc.parallelize(range(1000)).count()
1000
>>> sc.show_profiles()
My custom profiles for RDD:1
My custom profiles for RDD:3
>>> sc.stop()
v. Dump(id, path)
This function dump the profile into the path, here also id is the RDD id
def dump(self, id, path):
       if not os.path.exists(path):
           os.makedirs(path)
       stats = self.stats()
       if stats:
           p = os.path.join(path, "rdd_%d.pstats" % id)
           stats.dump_stats(p)
vi. Profile(func)
It performs profiling on the function func.
def profile(self, func):
       raise NotImplemented
vii. Show(id)
Moreover, this function Prints the profile stats to stdout. And here id is the RDD id.
def show(self, id):
       stats = self.stats()
       if stats:
           print("=" * 60)
           print("Profile of RDD<id=%d>" % id)
           print("=" * 60)
           stats.sort_stats("time", "cumulative").print_stats()
viii. Stats()
This function returns the collected profiling stats (pstats.Stats)
def stats(self):
       raise NotImplemented
class pyspark.BasicProfiler(ctx)
A default profiler, that is implemented on the basis of cProfile and Accumulator, is what we call a BasicProfiler.
[docs]    def profile(self, func):
       pr = cProfile.Profile()
       pr.runcall(func)
       st = pstats.Stats(pr)
       st.stream = None  # make it picklable
       st.strip_dirs()
       # It adds a new profile to the existing accumulated value
       self._accumulator.add(st)
i. profile(func)
This function runs as well as profiles the method to_profile passed in. Moreover, here a profile object is returned.
ii. stats()
def stats(self):
       return self._accumulator.value
So, this was all about PySpark Profiler. Hope you like our explanation.
Conclusion
Hence, we have seen whole about PySpark Profilers including their functions. Thus this article will definitely clear your concepts regarding PySpark Profilers. Still, if any doubt, ask in the comment tab.
We work very hard to provide you quality material
Could you take 15 seconds and share your happy experience on Google


Why we need a pyspark profiler ?
Whats the use of it and wen we should use?
Is it something similar to python memory profiler.
Please any help is much appreciated.