iostat command in Linux with examples
Job-ready Online Courses: Dive into Knowledge. Learn More!
In this article, we will learn everything about the iostat command in Linux. We will start right from the basics, like understanding the iostat command, why it is used, how to install it, the syntax of the iostat command, and the various options used with it.
We shall then look at numerous practical examples of the iostat command to understand its functioning better. Simultaneously, we will understand the output of each command by looking at what information the different fields and columns give us. So pay attention, grab a snack or coffee if you need and make it to the end of the article.
What is the iostat command?
Iostat is the abbreviation for input/output statistics. Iostat is a command-line-based inbuilt diagnosing utility in Linux-based operating systems that helps monitor input and output statistics for devices and partitions. To evaluate the performance of I/O devices, you need to calculate their efficiency with respect to time, which is what the iostat command does.
The iostat command is used to determine the CPU usage and other connected Input/Output devices with respect to time. It also helps monitor the CPU and other I/O devices connected to the system.
The iostat command gives out reports that can change the system configuration to raise the balance of the input/output between the physical disks. The iostat command is a part of the sysstat command.
Syntax of the iostat command in Linux
The syntax of the iostat command may look slightly intimidating at first, but when we look at the different fields present in the syntax and understand what they are for, it will become a cakewalk. The syntax of the iostat command is:
iostat <options> <delay <count>>
Let us look at the fields present in the syntax of the iostat command:
1. <options>
This field takes in a range of options that specifies how the iostat command should work and specify the output.
2. <delay>
This field specifies the interval between 2 updates. If you don’t specify a delay, the default value will be taken as infinite.
3. <count>
This field specifies the number of updates which is printed after each interval. If you don’t specify anything in this field, the default value will be taken as infinite.
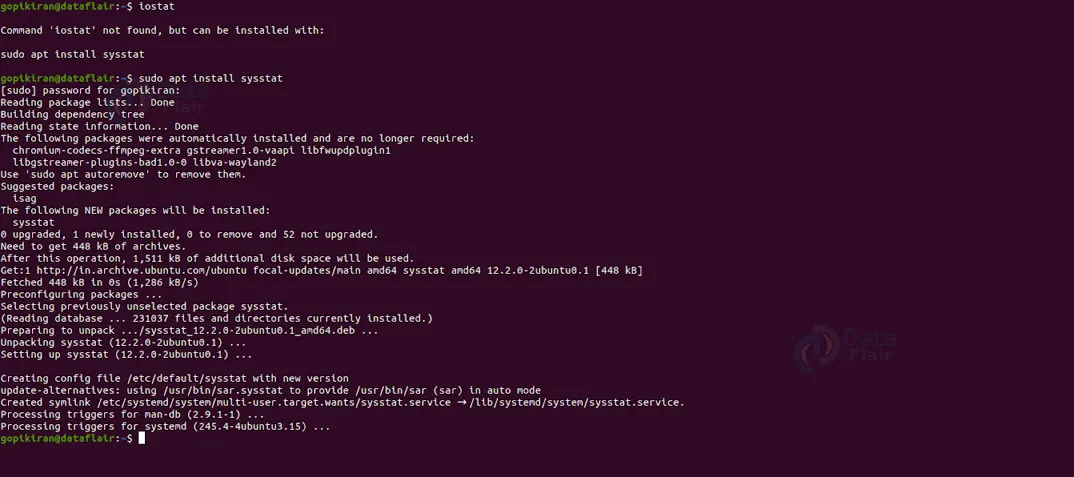
How to install the iostat command?
The reason I did not address this at the beginning is that most of the Linux distributions already come with the iostat command preinstalled. However, if your Linux distro does not have it, or if you uninstalled it, you can always install it using the commands shown below with respect to your Linux distro:
Installing iostat on RHEL-based Linux distributions
If you want to download iostat on RHEL-based Linux distros like Clear OS, Oracle Linux, Alma Linux, Rocky Linux, Cent OS, etc., use the command shown below:
apt-get install sysstat
Options used with the iostat command
Unlike most of the commands in Linux, the iostat command has only a few options associated with it. Let us take a brief look at each one of them:
1. -c
This option displays the report regarding CPU utilisation.
2. -d
This option displays the report regarding device utilisation.
3. -h
This option displays all the device utilisation reports that are easier to read by a human. It prints all the data in a human-readable format.
4. -k
This option prints the statistics in kilobytes per second.
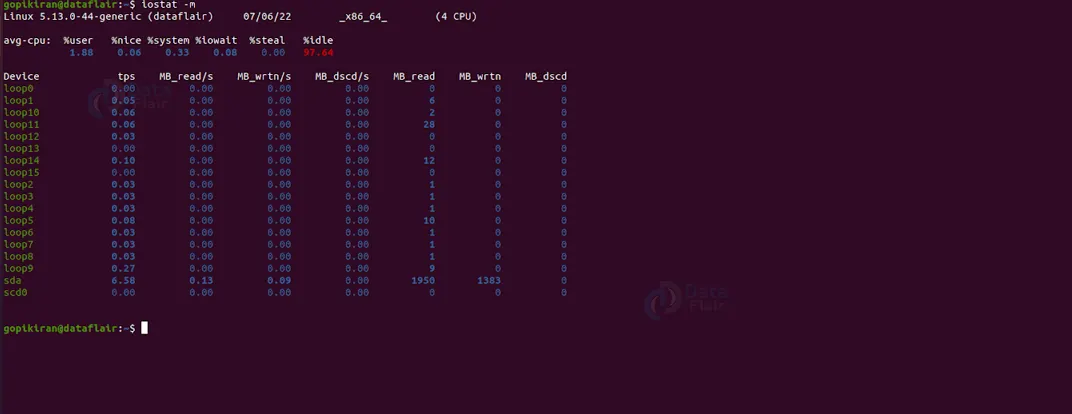
5. -m
This option prints the statistics in megabytes per second.
6. -N
This option prints the registered device mapper names for any device mapper devices.
7. -t
This option prints the time for each report displayed.
8. -x
This option prints the extended statistics.
9. -z
This option tells the iostat option to omit the output for devices with no activity during the sample period.
10. -p
This option prints the statistics for block devices and all their partitions used by the system.
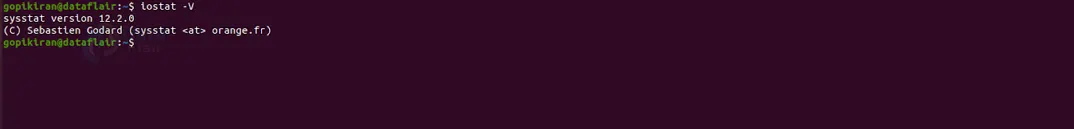
11. -V
This option prints information regarding the version of iostat command as shown:
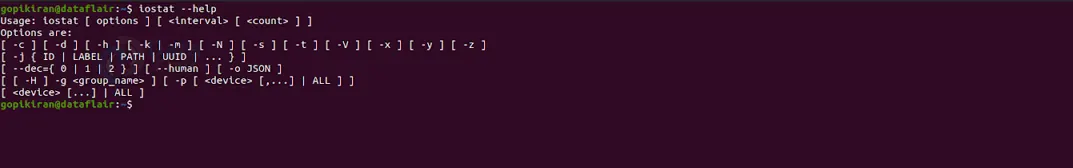
12. –help
This option prints the help menu of the iostat command, as shown below:
The screenshot above shows us that the iostat gives us a ton of information through various columns. Let us understand what each column is for in brief:
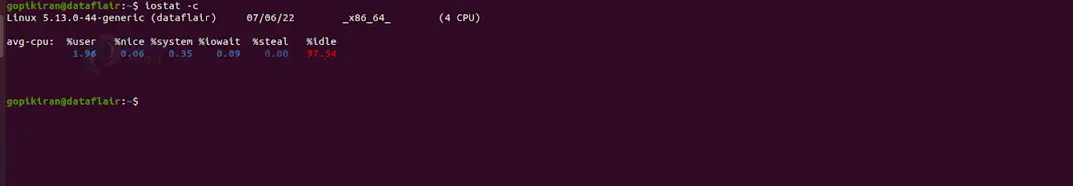
The first section contains the following columns:
- %user – Percentage of CPU utilisation when executing at the user level.
- %nice – Percentage of CPU utilisation when executing with a nice priority at the user level.
- %system – Percentage of CPU utilisation when executing at the system level.
- %iowait – Percentage of the time the CPU idles while the system had an outstanding disk I/O request.
- %steal – Percentage of the time spent in involuntary waiting by the virtual CPU while another virtual processor serviced the hypervisor.
- %idle – Percentage of the time that the CPU or CPUs were idle while the system did not have an outstanding disk I/O request.
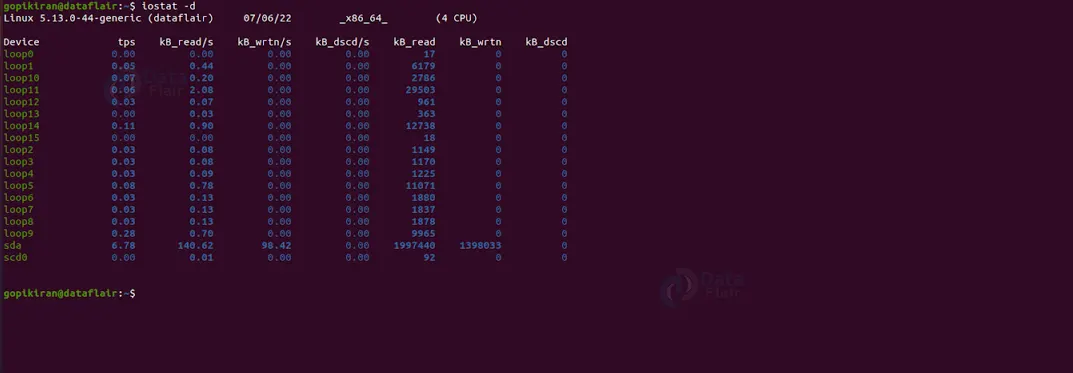
The second section contains the following columns:
- Device – The device/partition name is listed in the/dev directory.
- tps – number of transfers per second issued to the device. Higher tps means the processor is busier.
- Blk_read/s – Data read from the device expressed in a number of blocks (kilobytes, megabytes) per second.
- Blk_wrtn/s – Data written to the device expressed in a number of blocks in the form of kilobytes or megabytes per second (Kbps, or Mbps).
- Blk_read – Total number of blocks read.
- Blk_wrtn – Total number of blocks written.
Files used by linux iostat command
The iostat command uses the following files in your system to produce such intricate reports.
- /proc/stat – System statistics.
- /proc/uptime – System uptime.
- /proc/diskstats – Disks statistics.
- /sys – Block devices statistics.
- /proc/self/mountstats – Network filesystems statistics.
- /dev/disk – Contains the persistent device names.
Let us look at some examples of the iostat command in the terminal of Ubuntu 20.04 to understand its functioning and reports better.
Printing a detailed report
If you are not satisfied with the report the regular iostat command gives you, you can print a more detailed report by pairing the iostat command with the option “-x” as follows:
iostat -x
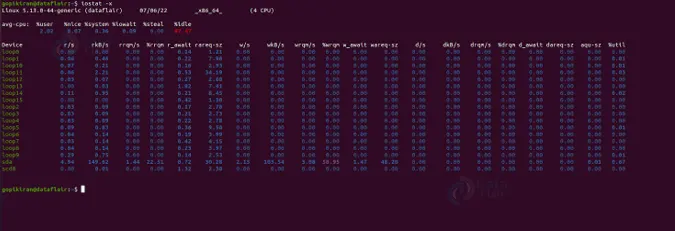
Let us look at the column of the output in the screenshots shown above:
1. avg-cpu:
This field gives us the cpu block information.
2. Divide:
This field gives us the device block information.
3. %util:
This field gives us the time it took for the storage device was busy.
4. svctm:
This field indicates how fast your I/O subsystem responds to requests when busy.
5. await:
This field indicates how fast requests go through.
6. avgqu-sz:
This field gives us the number of requests in a request queue.
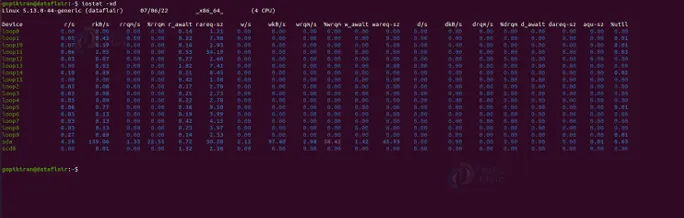
7. avgrq-sz:
This field gives us the average request size, which can indicate the kind of workload that happens.
8. wsec/s & rsec/s:
This field gives us the sectors that are read and written per second. If we divide this field by 2048, we’ll get the megabytes per second (Mbps).
9. r/s & w/s:
This field gives us the number of read and write requests per second.
10. rrqm/s & wrqm/s:
This field gives us the number of requests merged by the block layer.
Showing only the CPU statistics
If you want to show only the CPU statistics, we can pair the iostat command with the option “-c” as shown:
iostat -c
Printing only the device report
We can only show the device’s utilisation status by executing the iostat command with the option “-d” as shown:
iostat -d
Printing I/O statistics
If you wish to print only the extended I/O statistic for the device, pair the iostat command with the options “-x” and “-d” as shown:
iostat -xd
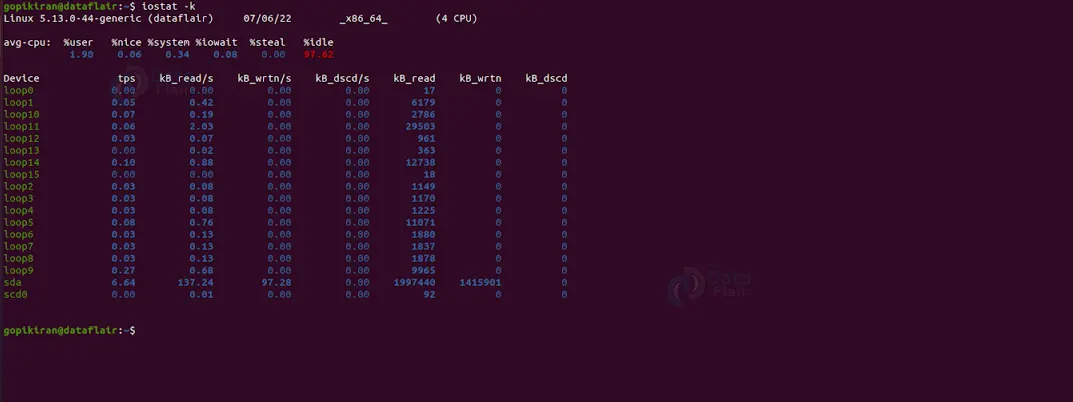
Showing statistics in kilobytes
If you want to make it easier to read the statistics and show them in kilobytes instead of the byte units the iostat command shows us, use the option “k” as shown:
iostat -k
Showing statistics in megabytes
If you want to make it easier to read the statistics and show it in megabytes instead of the byte units the iostat command shows us, use the option “k” as shown:
iostat -k
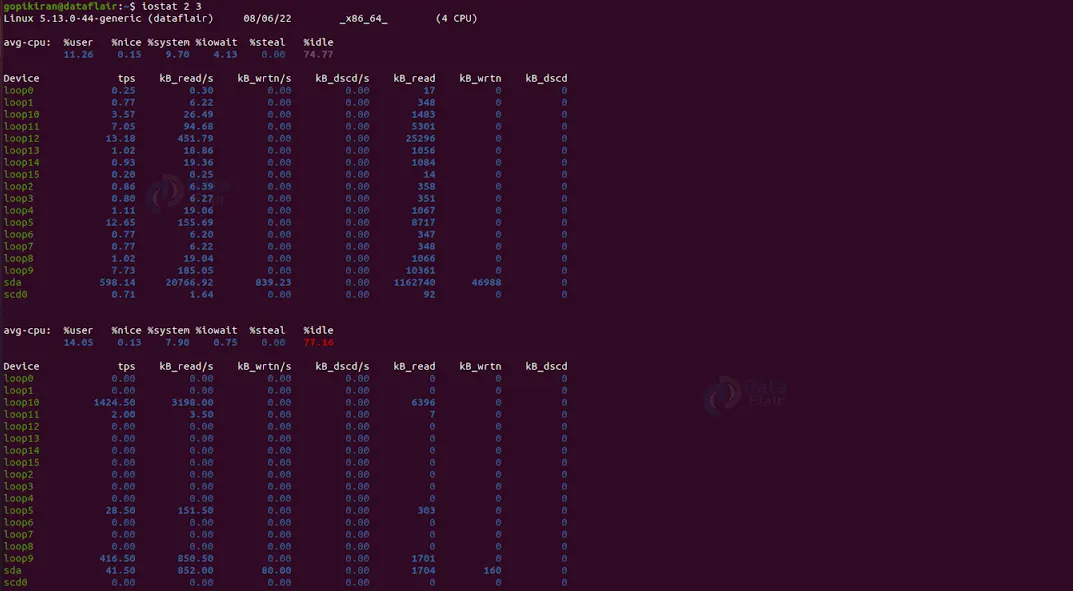
Specifying a delay and count
If you want to print a report for a specific number of times with a particular interval of time, use the syntax shown below:
iostat <options> <delay <count>>
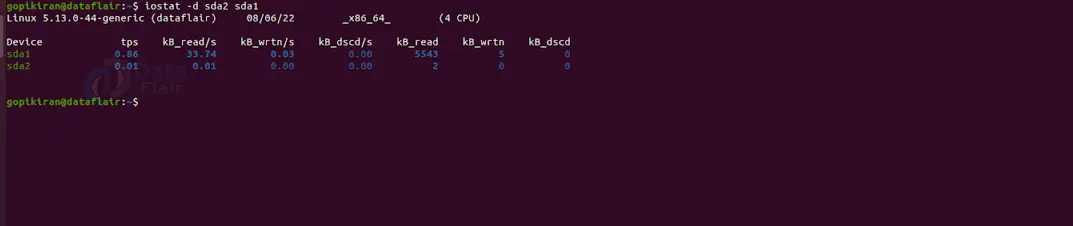
Listing the statistics of specific device partitions
If you wish to list the statistics regarding some specific device partitions, run the iostat command along with the option “-d” followed by the names of the partitions separated by a space as shown below:
iostat -d <partition1> <partition2>
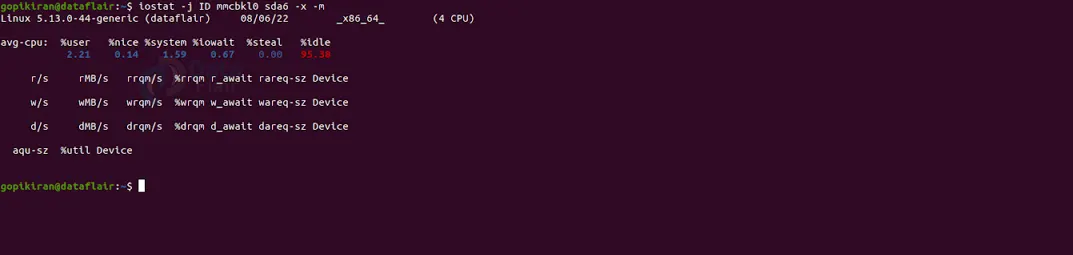
Displaying persistent device name statistics
The command shown below prints the persistent device name statistics.
iostat -j ID mmcbkl0 sda6 -x -m
You can print the report by device name by simply specifying its ID.
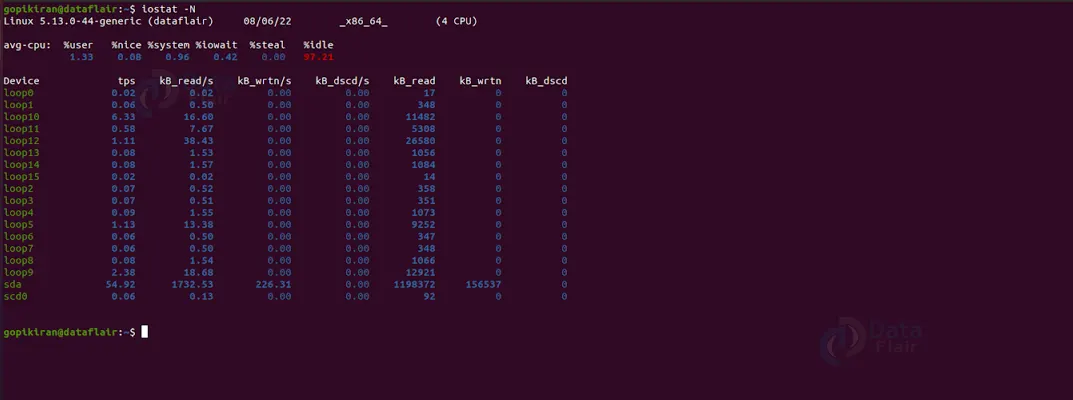
Displaying lmv2 statistics
To view the LVM statistics, pair the iostat command with the option “-N” as shown:
iostat -N
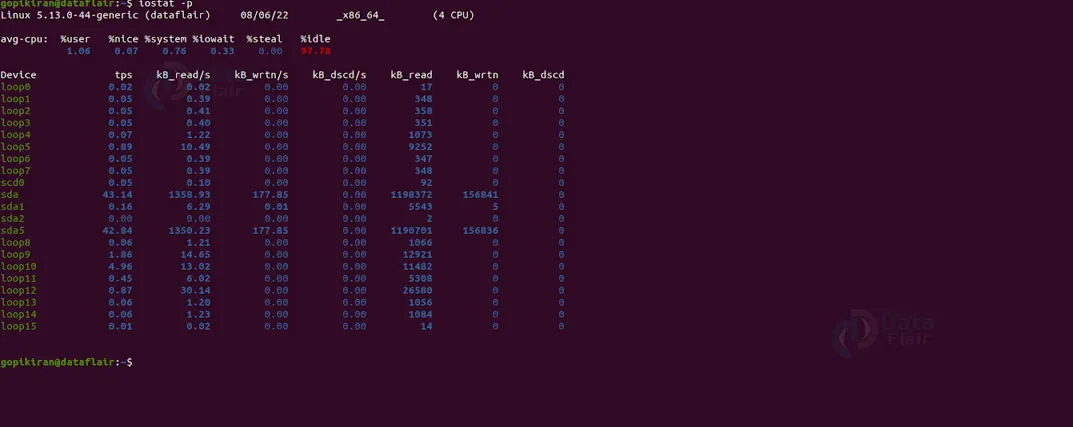
Displaying block device statistics
We can display the statistics and all the partitions for block devices that are being used by the system without the need to indicate each of the device names by simply pairing the iostat command with the option “-p” as shown:
iostat -p
Summary
As you have seen, the iostat command is a simple command that gives us statistics regarding your system’s input and output devices. You have now learned the iostat command, why it is used, how to install it, and the syntax and options used with the iostat command.
We have also looked at some beautiful examples of the iostat command, where we understood its output fields and also saw how to combine the iostat command with various options to produce various statistics.
We work very hard to provide you quality material
Could you take 15 seconds and share your happy experience on Google


