SciPy Interpolation
Machine Learning courses with 100+ Real-time projects Start Now!!
The SciPy library is generally for mathematical and statistical computations. There are sub-packages in the library that manage more specific functionalities. There is the scipy.interpolation that has specific usage in the field of statistics. Let us learn more about SciPy Interpolation.
SciPy Interpolation
The process of interpolation means locating a value between two points. We can consider the two points to be on a line or over a curve. The meaning of the word interpolation is split as “inter” which means “enter”, that means estimating a set of data by looking into it.
Interpolation is basically looking between two data points for the estimation of the value in between the two. It is generally used in any field requiring value estimation from a set of data.
Interpolation is carried out using the scipy.interpoation package. Its working is dependent on other libraries like numpy and matplotlib.
We create an array and then apply the interpolation functions.
import numpy as np
x = np.linspace(0,3,15)
y = np.sin(x**3/9)
print (x)
print(y)
Output
1.28571429 1.5 1.71428571 1.92857143 2.14285714 2.35714286
2.57142857 2.78571429 3. ]
[0. 0.00109329 0.00874624 0.02951466 0.06991376 0.13623681
0.23396278 0.36627253 0.53098857 0.7152709 0.88814574 0.99332329
0.94973234 0.67401073 0.14112001]
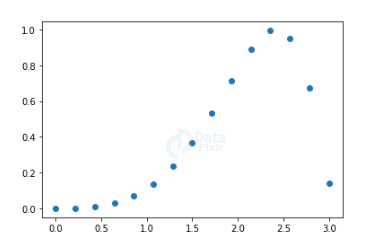
We have used the linspace() and sin() function to generate two sets of arrays. Now we will use the plot function to check the value plot. We have to import the matplotlib package.
import matplotlib.pyplot as plt
plt.plot(x,y,'o')
plt.show()
Output
1D Interpolation in SciPy
The interpolation module provides the interp1d class that is meant to create functions on the basis of the input data set. We can create new functions with different interpolation techniques. There is a variety of interpolation techniques:
- Linear
- Nearest
- Cubic
- Zero
- S-linear
- Quadratic
The syntax for 1 D interpolation is:
func = interp1d(x, y ,kind = ‘ ‘)
The x denotes the data points, y denotes the data values and the third parameter kid represents the type of interpolation technique.
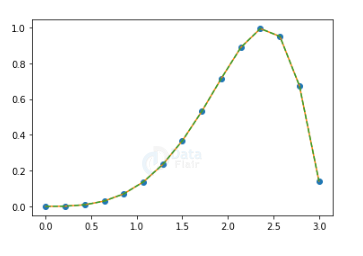
We plot two new functions using the previous data set.
from scipy.interpolate import interp1d
f1 = interp1d(x, y,kind = 'linear')
f2 = interp1d(x, y, kind = 'cubic')
plt.plot(x, y, 'o', x, f1(x), '-', x, f2(x), '--')
plt.show()
Output
Splines in SciPy
It is a tool for smoothening of the curves. It is an ancient method where pins were placed along the curve for obtaining smooth curves. The spline technique is like using a flexible strip at selective points to obtain a smooth curve.
We make the curve smooth in two steps. First, we make the spline representation of the curve. Then we smoothen the curves at the desired points.
We use the splrep() function to represent a two-dimensional curve. The default order of the spline is cubic which can change by changing the input parameters.
Univariate Spline
It is a class in SciPy for function creation with fixed data points.
The syntax is as follows:
scipy.interpolate.UnivariateSpline(x, y, w = None, bbox = [None, None], k = 3, s = None, ext = 0, check_finite = False).
- The parameter w specifies the weight, which is a positive value.
- The s value defines the number of points for smoothening.
- The value of ‘k’ defines the degree of smoothening.
- The parameter ‘ext’ defines the extrapolation mode.
- The ‘check_finite’ value is to make sure the values are only finite.
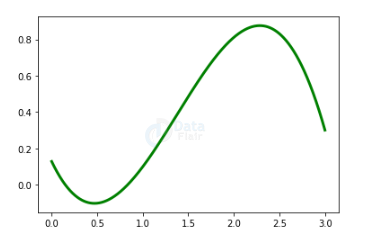
import matplotlib.pyplot as plt
import numpy as np
from scipy.interpolate import UnivariateSpline
x = np.linspace(0, 3,15)
y = np.sin(x**3/9)
spl = UnivariateSpline(x, y)
xs = np.linspace(0, 3, 1000)
plt.plot(xs, spl(xs), 'g', lw = 3)
plt.show()
Output
Summary
SciPy includes all the necessary scientific and mathematical functions. The library contains additional sub-packages of which Interpolation is one. The package has very useful functions for statistical operations.
These are actually useful when determining an intermediate data value from a given data set. It has its use in many sectors including business and many other scientific fields.
If you are Happy with DataFlair, do not forget to make us happy with your positive feedback on Google


