SciPy Cluster – K-Means Clustering and Hierarchical Clustering
Machine Learning courses with 100+ Real-time projects Start Now!!
SciPy is the most efficient open-source library in python. The main purpose is to compute mathematical and scientific problems. There are many sub-packages in SciPy which further increases its functionality. This is a very important package for data interpretation.
We can segregate clusters from the data set. We can perform clustering using a single or multi-cluster. Initially, we generate the data set. Then we perform clustering on the data set. Let us learn more SciPy Clusters.
SciPy Cluster
K-means Clustering
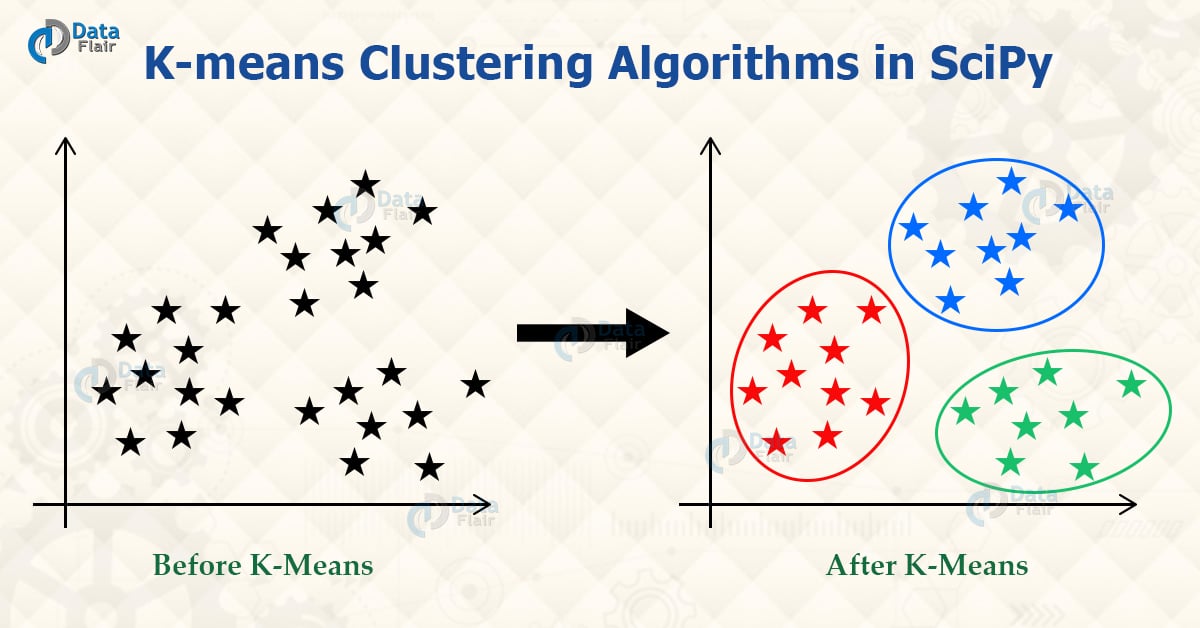
It is a method that can employ to determine clusters and their center. We can use this process on the raw data set.
We can define a cluster when the points inside the cluster have the minimum distance when we compare it to points outside the cluster. The k-means method operates in two steps, given an initial set of k-centers,
- We define the cluster data points for the given cluster center. The points are such that they are closer to the cluster center than any other center.
- We then calculate the mean for all the data points. The mean value then becomes the new cluster center.
The process iterates until the center value becomes constant. We then fix and assign the center value. The implementation of this process is very accurate using the SciPy library.
Implementation of K-means
We need to import the k-means, vq, and whiten functions from the SciPy library.
We Generate the initial data set to perform clustering.
import scipy
from scipy.cluster.vq import kmeans,vq,whiten
import numpy as np
# data generation
data = np.array([[  1.9,2.3,1.7],
                 [  1.5,2.5,2.2],
                 [  0.8,0.6,1.7]])
data
Output
[1.5, 2.5, 2.2],
[0.8, 0.6, 1.7]])
Then we whiten the data. We use the whitening function to linearly transform the data set. It then produces uncorrelated data having variance 1.
from scipy.cluster.vq import whiten
data =whiten(data)
data
Output
[3.29956009, 2.93273208, 9.33380951],
[1.75976538, 0.7038557 , 7.21248917]])
We now perform clustering on the data set. The process iterates until we find the final cluster center.
from scipy.cluster.vq import kmeans
centroids = kmeans(data,3)
print(centroids)
Output
[0.8, 0.6, 1.7],
[1.9, 2.3, 1.7]]), 0.0)
We now implement the vq function. The vq function assigns the centroid to the closest cluster. The function returns the cluster for each observation and also the distortion.
from numpy import array
from scipy.cluster.vq import vq
centroids = array([[1.,1.,1.],
                  [2.,2.,2.]])
data  = array([[  1.9,2.3,1.7],
                 [  1.5,2.5,2.2],
                 [  0.8,0.6,1.7]])
vq(centroids,data)
Output
K-Means Clustering with three Clusters
We perform the K-Means clustering on a set of clusters. The algorithm is to determine the centroid. The process iterates until we find the centroid of the cluster that does not further change. In the below code we perform clustering on the data and iterate the process. We then print the centroid value.
# computing K-Means with K = 3 (2 clusters)
centroids,_ = kmeans(data,3)
print(centroids)
Output
[ 2.63788572 2.81446462 2.85163854]
[ 0.73507256 1.30801855 1.44477558] ]
Low-level Parallelism
Parallelism is done for optimizing and regulating costly operations. The parallelism is done in K-means through Cython. Small chunks of data (256 samples) are processed in parallel. This also helps memory optimization.
example- parallelism on handwritten data set.
Mini Batch K-Means
This is an alternative of the K-means algorithm. We use it to reduce the computational time. We consider subsets of the data and we then iterate over these sets.
The mini-batches of sets are selected at random. The selection of subsets leads to a lot of time reduction. Although, the results deviate from the standard algorithm.
Initially, samples are drawn randomly from the dataset, to form a mini-batch. These are then assigned to the nearest centroid. We then update the centroid values. We perform these steps on individual mini-batches. The following steps iterate until the constant centroid is found.
Affinity Propagation
In this case, the clusters are generated by sending messages. A dataset is described by their identifiers, that represent the individual data sets. The messages are sent between data pairs until there is a convergence. The process iterates until we find the fixed centroid.
Mean Shift
The main aim of this algorithm is to determine blobs in the samples. The algorithm is based on the centroids and it updates the centroids the mean value of the data set.
The process iterates until we find the centroids. Then it performs filtering and eliminates redundant centroids. We then get a final set of centroids.
SciPy Hierarchical Clustering
It has a complex structure that defines nested clusters. We can then merge and split these nested clusters, This hierarchy of clusters is shown in a tree representation. The roots represent unique clusters and gather all the values. Leaves consist of single sample values.
SciPy Spectral Clustering
This type of clustering is meant for embedding matrices. After that, we perform clustering on the samples. We perform clusterin on the components of eigenvectors in low dimensions. The drawback of this type is that it only works for small clusters. It is not a preferable method for large clusters.
SciPy DBSCAN
In this algorithm we consider the clusters to be of high density and these are separated by areas of low density. The benefit of this algorithm is that it can work with clusters of any shape. Unlike in the case of k-means that considers only convex shape clusters.
The central components of the cluster are areas of highest density. The structure of the cluster is a set of core samples in close proximity and non-core samples.
SciPy OPTICS
This algorithm is similar to the DBSCAN algorithm, it shares many properties. It is a generalization of DBSCAN. Unlike DBSCAN it does not require one value in each range.
The main difference is that OPTICS consists of a reachability graph. It has two attributes reachability and order to assign the cluster membership of the components.
Birch
In the case of birch we build a tree, it is known as the Clustering Feature Tree(CFT). The data is divided into nodes, namely Clustering feature Nodes. The nodes are then divided further into subclusters.
These sub-clusters are known as Clustering Feature subclusters. The ones located in the nonterminal position have child CF nodes.
Performance Evaluation
It is not a simple task to evaluate the clustering algorithm like counting the errors or checking the precision. We cannot take any absolute values for evaluation. We rather define the separations between similar data. Then we evaluate the efficiency of the centroids generated.
Summary
Finally, we saw the SciPy Cluster. We use the SciPy cluster module for data arrangement. First, we generate the array for data creation. We then determine clusters from those arrays by implementing the cluster functions. It helps us define clusters in the given data set.
Then we determine the SciPy cluster centers. According to centers, we determine the cluster data points. This is hence a very good module for code reuse.
Your opinion matters
Please write your valuable feedback about DataFlair on Google


