PyTorch Tensorboard
Machine Learning courses with 100+ Real-time projects Start Now!!
Google originally developed Tensorboard for Tensorflow, and since PyTorch 1.1.0, it has been added to it due to the collaboration with Google’s tensorboard team.
It is a visualisation tool which helps us take a sneak peek at the functionality of our models. For example, we can monitor the training process by plotting the learning curves. We can also visualise the tensors by plotting histograms, images in the training set, object detection boxes etc.
Installing and Opening Tensorboard:
To install the tensorboard, open the anaconda prompt or the terminal, as the case may be and run the following command.
pip install tensorboard
Now that we have installed tensorboard, we can open it by running the following command in Anaconda Prompt.
tensorboard --logdir=run
On running this command, we get a message stating that tensorboard is available at a local server. So, we need to copy this address (which will look something like this ::http://localhost:6006/) and browse it in a web browser.
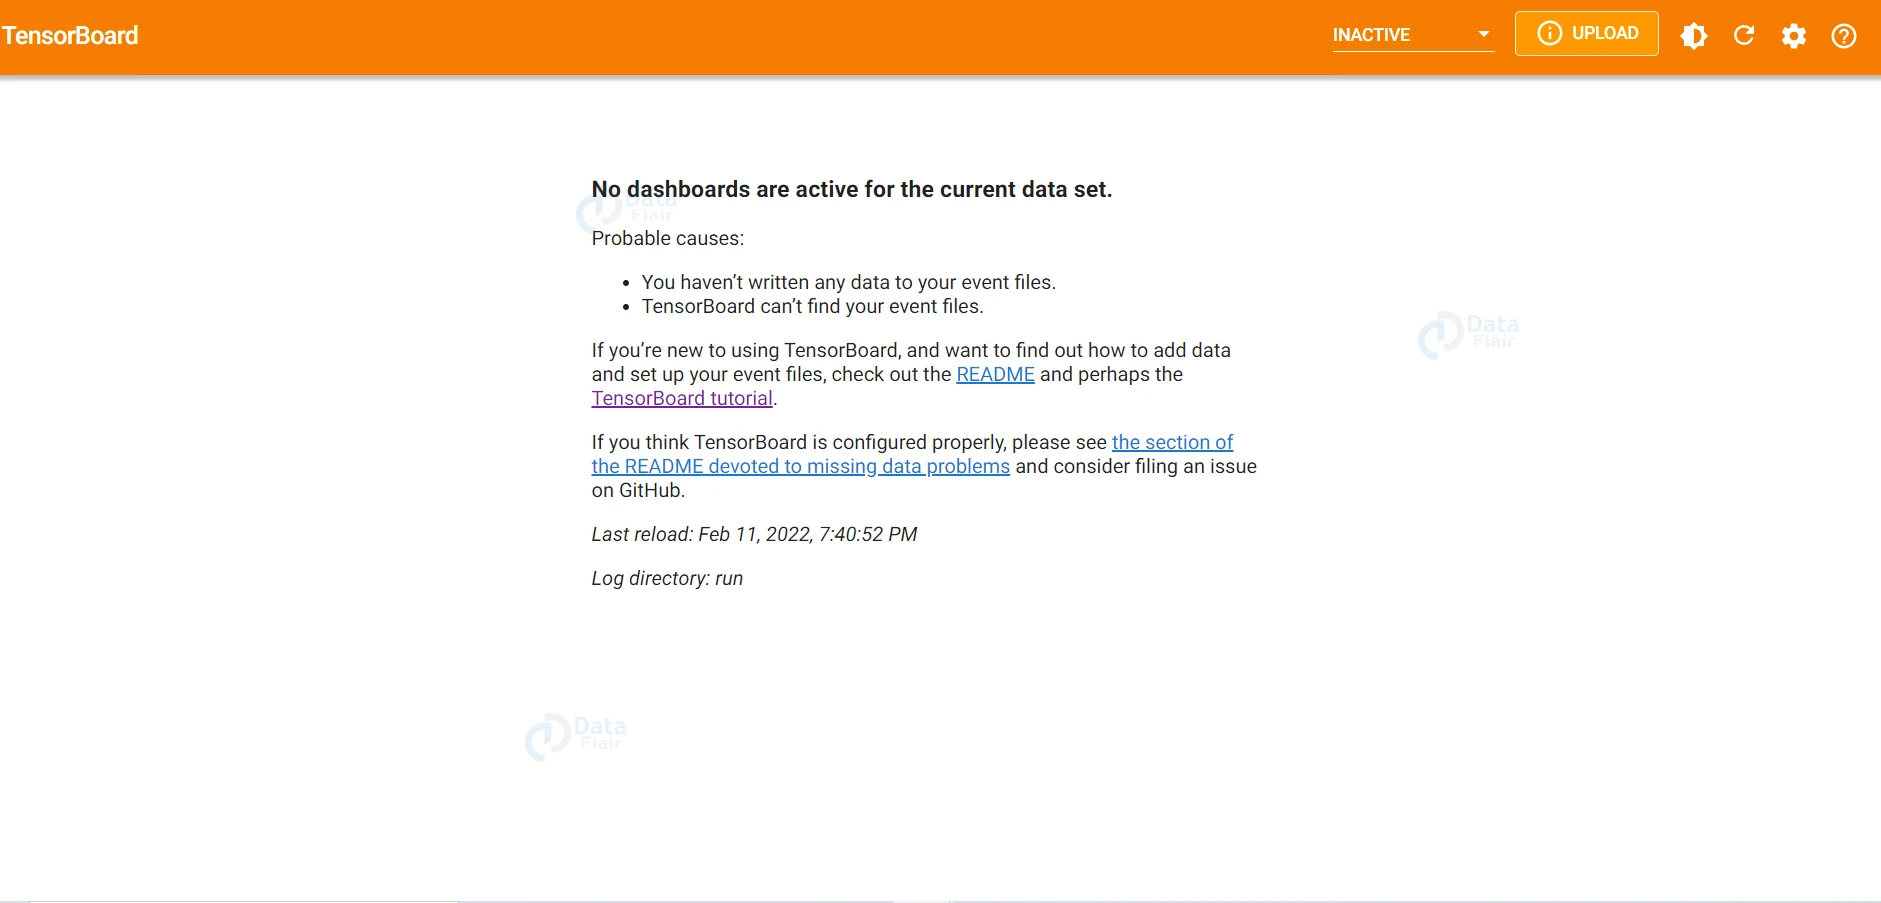
This is what tensorboard looks like. Since we have not built any models yet, it does not display anything.
Using Tensorboard
Firstly, we have to import tensorboard along with other required libraries. Along with the libraries we need for our model, we also need to import SummaryWriter from torch.utils.tenosrboard to use it.
from torch.utils.tensorboard import SummaryWriter
After importing SummaryWriter we have to create an instance of the SummaryWriter class.
writer=SummaryWriter('run/cnn')
a. Visualising the Training Set Images:
dataiter=iter(trainset)
images,labels=dataiter.next()

img_grid = torchvision.utils.make_grid(images)


# write to tensorboard
writer.add_image('_mnist_images', img_grid)
In the above code segment, we have defined an iterable using the dataloader and with the command writer.add_image(‘_mnist_images’,img_grid), we have added the visuals to the tensorboard with the title being ‘_mnist_images’.
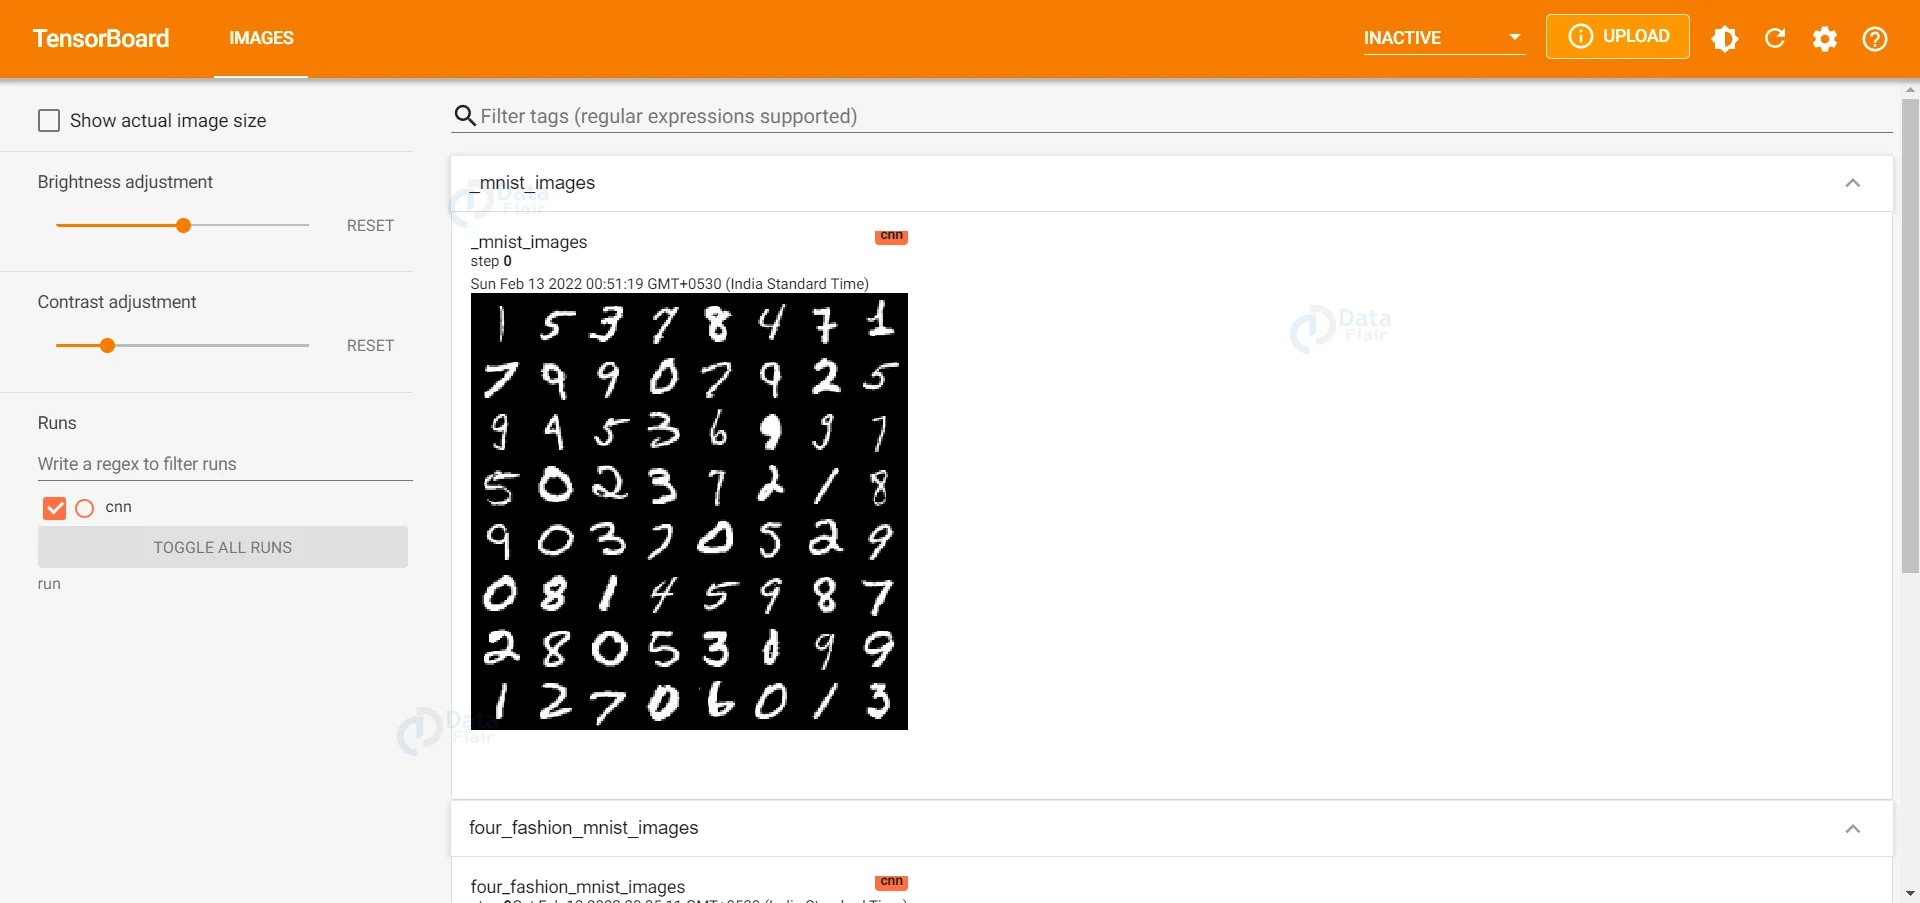
When we refresh the tensorboard tab, we can see the training images as shown above.
b. Histograms and Graphs:
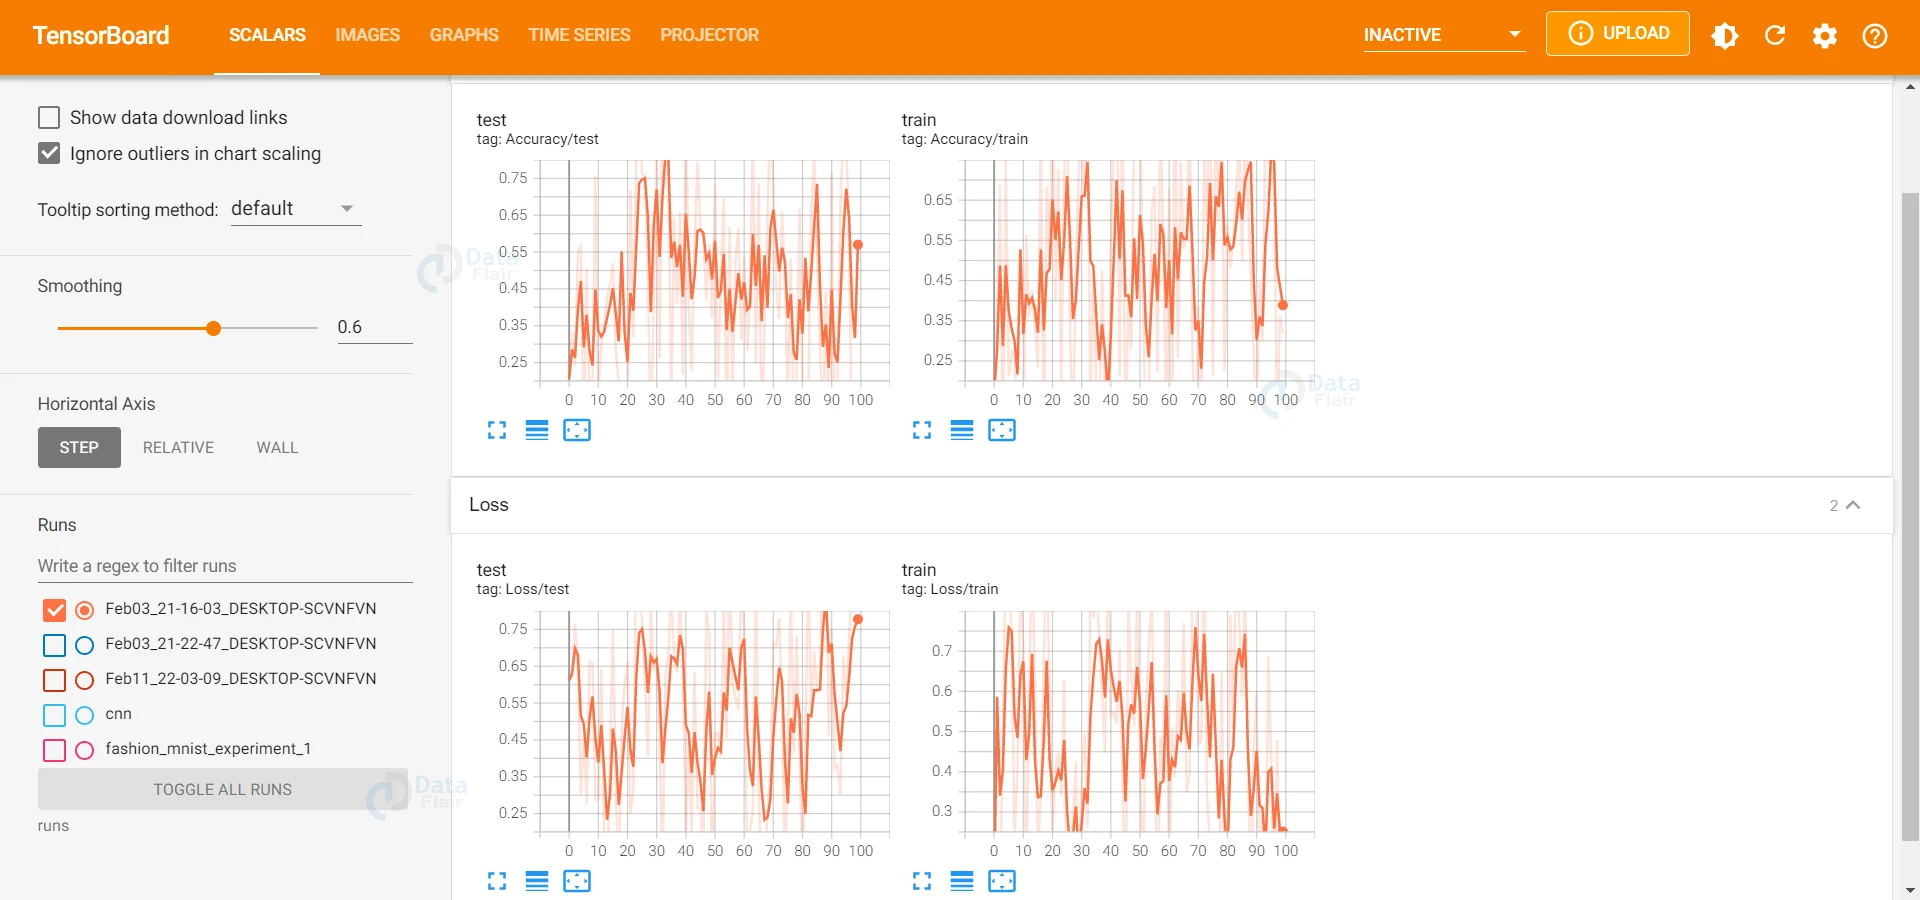
Plotting Histograms on a tensorboard is easy and can be accomplished using just a single line of code.
writer.add_scalar('Loss/train', np.random.random(), n_iter)Tensorboard has a navigation bar that lets us see the scalars, graphs, images etc. The best part is it gives us a picture of how our model has been designed and working and gives us insight into the parameters that can be changed to improve the model’s performance.
c. Complete code:
import torch
import torchvision
import torch.nn as nn
import torch.optim as optim
from torchvision import transforms,datasets
import torch.nn.functional as F
import matplotlib
import matplotlib.pyplot as plt

from torch.utils.tensorboard import SummaryWriter


train=datasets.MNIST("", train=True,download=True,transform=transforms.Compose([transforms.ToTensor()]))
test=datasets.MNIST("", train=False,download=True,transform=transforms.Compose([transforms.ToTensor()]))


trainset=torch.utils.data.DataLoader(train,batch_size=64,shuffle=True)
testset=torch.utils.data.DataLoader(test,batch_size=64,shuffle=True)


class ConvNet(nn.Module):
    def __init__(self):
    	super(ConvNet,self).__init__()
    def forward(self):
    	model=nn.Sequential(nn.Conv2d(1,10,5,padding=2),
                    	nn.ReLU(),
                    	nn.AvgPool2d(2,stride=2),

                    	nn.Conv2d(10,20,5,padding=0),
                    	nn.ReLU(),
                    	nn.AvgPool2d(2,stride=2),

                    	nn.Flatten(),
                    	nn.Linear(500,250),
                    	nn.ReLU(),
                    	nn.Linear(250,100),
                    	nn.ReLU(),
                    	nn.Linear(100,10)
                   	)
    	return model


    def validate(self,model,data):
    	total=0
    	correct=0
    	for i,(images,labels) in enumerate(data):
        	x=model(images)
        	value,pred=torch.max(x,1)
        	total+=x.size(0)
        	correct+=torch.sum(pred==labels)


    	return correct/total


cnn=cnn_model.forward().to(device)
cel=nn.CrossEntropyLoss()
optimizer=optim.Adam(cnn.parameters(),lr=0.01)

for epoch in range(epoch):
    for i,(images,labels) in enumerate(trainset):
    	images=images.to(device)
    	labels=labels.to(device)
    	optimizer.zero_grad()
    	pred=cnn(images)
    	loss=cel(pred,labels)
    	loss.backward()
    	optimizer.step()

    accuracy=cnn_model.validate(cnn,testset)
    print(epoch,accuracy)


dataiter=iter(trainset)
images,labels=dataiter.next()

img_grid = torchvision.utils.make_grid(images)


# write to tensorboard
writer.add_image('_mnist_images', img_grid)
Sharing Tensorboard Dashboards
To share our tensorboard dashboards, we can upload them to the server and then share their link to the concerned party.
Run the following command on the anaconda prompt to upload.
tensorboard dev upload --logdir runs
Now, some processes will be initiated, and you will be asked if you want to continue. Enter “yes”. Then you will be given a link. Go to the link and enter the authentication code to complete the process.
Our dashboard has now been uploaded, and we can navigate to it using the given link.
Note that you should not upload sensitive data as all the uploaded files are public.
Summary
Tensorboards can be a crucial tool for us to visualise the performance of our models and act accordingly. It can be used to view training images, audio, videos, histograms etc., giving us a sneak peek into the internal working of our models.
Your opinion matters
Please write your valuable feedback about DataFlair on Google


