How to Monitor Virtual Machines in Azure?
Top AWS Course for AWS Certified Cloud Practitioner (CLF-C01) Start Now!!
We offer you a brighter future with industry-ready online courses - Start Now!!
In our previous articles, we saw about virtual machines, hosting virtual machines. But, today’s article is special today we will see how you can monitor those Azure Virtual Machines. So, let us start!!!
What is Azure Monitor?
Azure Monitor is a full-featured monitoring service that lets you keep track of all of your Azure virtual machines.
However, because Azure Monitor’s functions are linked into the Azure site for the Azure services it monitors, you don’t need to interface with it directly to do a range of monitoring tasks. Monitor Azure resources with Azure Monitor is a tutorial that provides an overview of how Azure Monitor works with Azure resources.
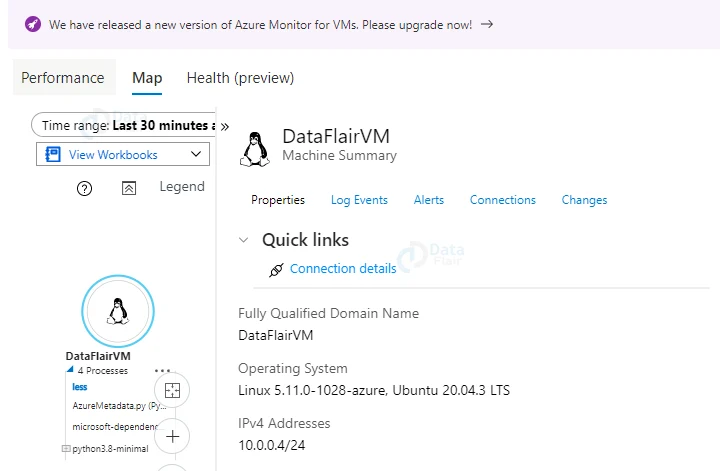
Overview Page
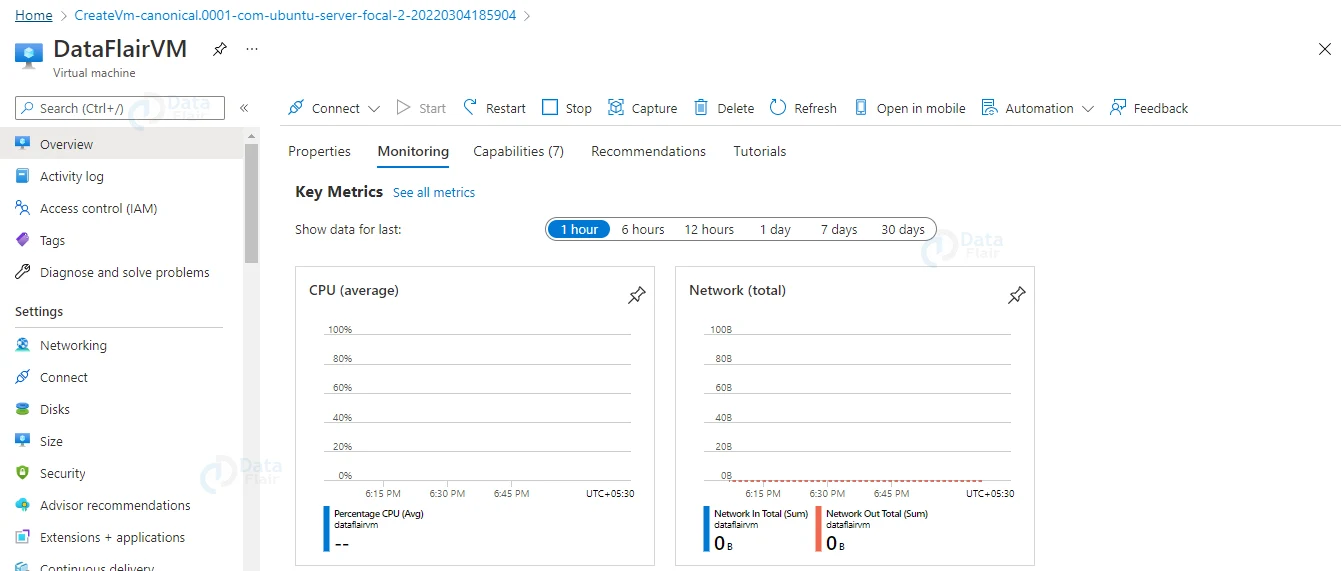
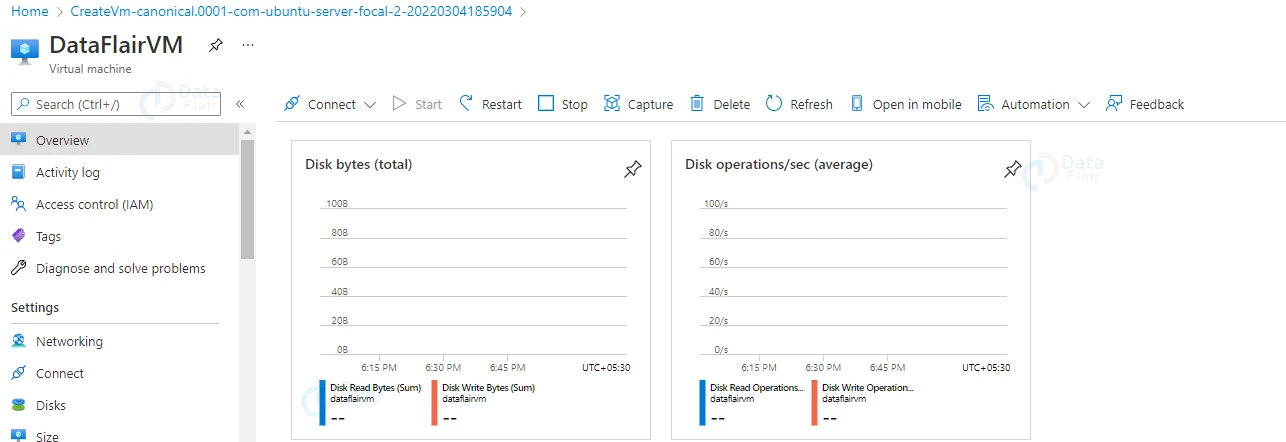
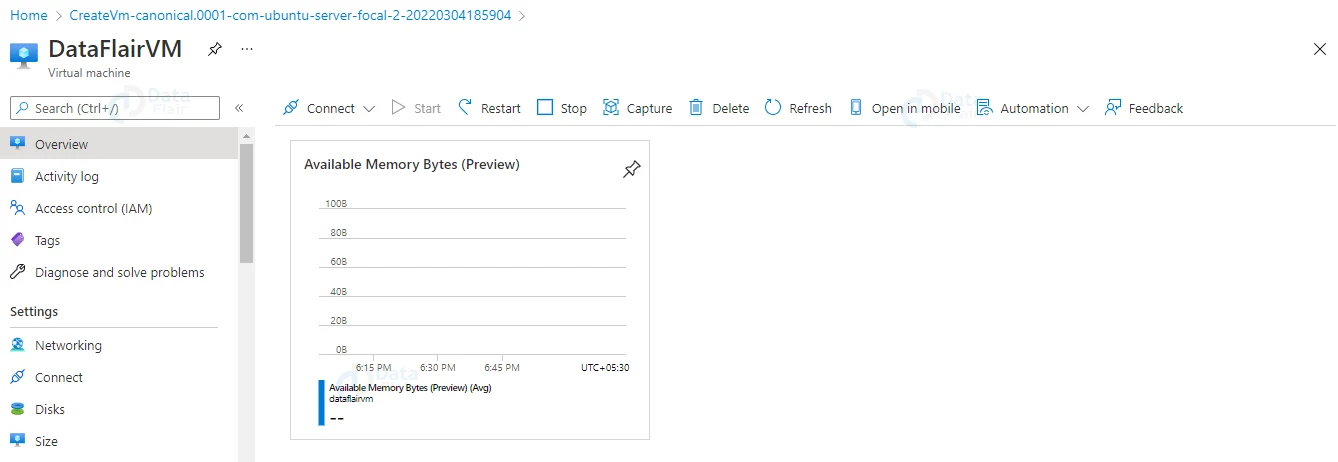
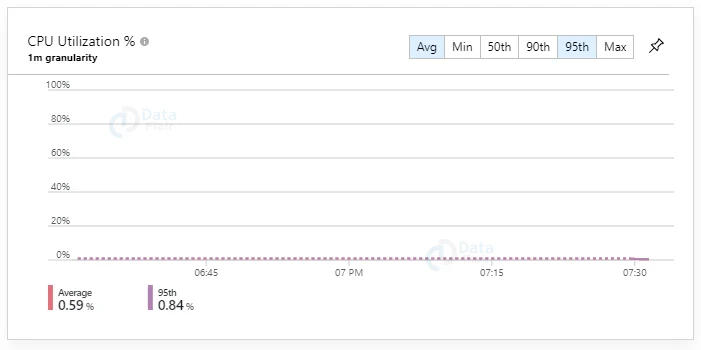
To get started with Azure Monitor, navigate to your virtual machine’s Overview page and then select the Monitoring tab. Key health measures, such as average CPU and network utilization, are displayed in the Key Metrics window.
You can adjust the time range for the charts by selecting a duration at the top of the window, or select a chart to open the Metrics pane and dive down further or add an alert rule.
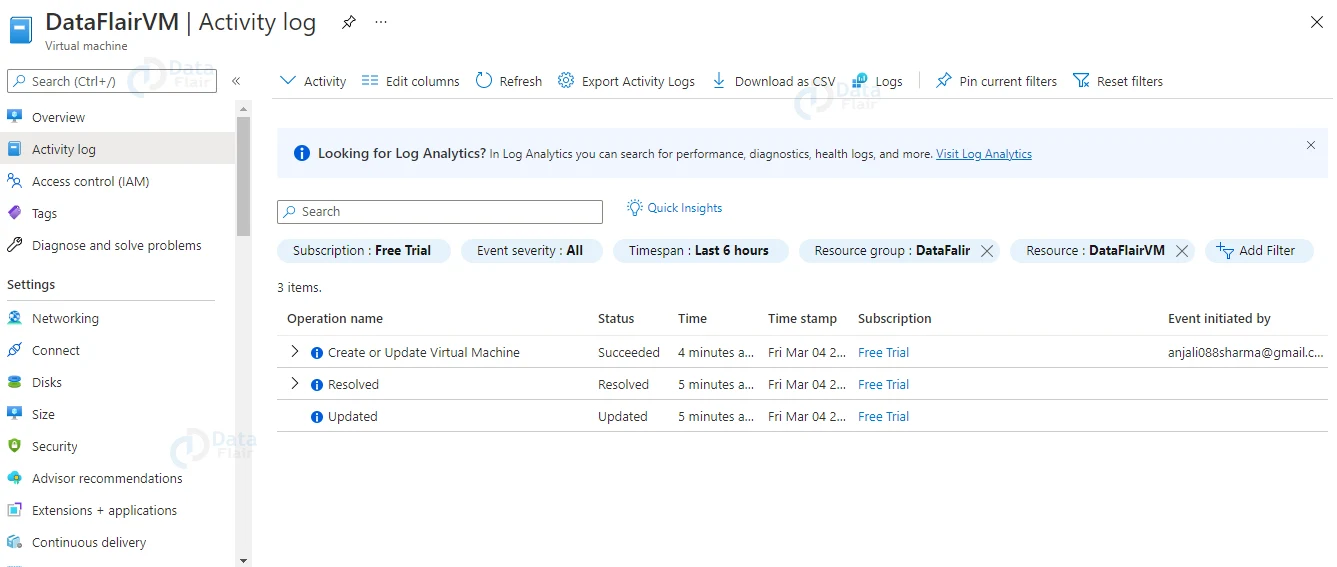
Azure Activity log
In Azure, the Activity log shows the virtual machine’s recent activity, such as any configuration changes and when it was stopped and started. View the Activity log on the Azure portal, or establish a diagnostic setting to transmit it to a Log Analytics workspace, where you can watch events unfold over time and compare them to other data.
Azure VM insights
In Azure Monitor, several Azure services display customized monitoring experiences. These are known as insights, and they include pre-built workbooks and other specialized features specific to that provider.
VM insights is a monitoring tool that lets you keep track of all of your Azure and hybrid virtual machines from one place.
When monitoring numerous virtual machines in your Azure environment, you should enable VM insights for the following features:
Log Analytics and Dependency agent onboarding has been simplified. This allows you to monitor a virtual machine’s guest operating system and workloads.
You may evaluate core performance indicators from the virtual machine’s guest operating system using pre-defined trending performance charts and workbooks.
The dependency map shows the processes that operate on each virtual machine as well as the components that are connected to other machines and external sources.
Note: See Enable Azure Monitor for a single virtual machine or virtual machine scale set in the Azure portal for fast instructions on configuring VM insights and enabling monitoring for a virtual machine.
Collecting Guest Metrics and Logs in Azure
When you establish a virtual machine, Azure Monitor begins collecting metric data for it automatically.
However, you must install an agent to collect metrics from the virtual machine’s guest operating system.
When you activate VM insights, the Log Analytics agent is installed and begins providing performance data to Azure Monitor Logs, allowing the Performance and Map views to be enabled.
See Enable monitoring for Azure virtual machines for a tutorial on how to enable VM insights for a virtual machine.
Install the Azure Monitor agent after you’ve enabled VM insights so you may gather guest logs from your virtual machine and provide guest metrics to the Azure Monitor Metrics pane. You may also use the Metrics window to evaluate metrics this way.
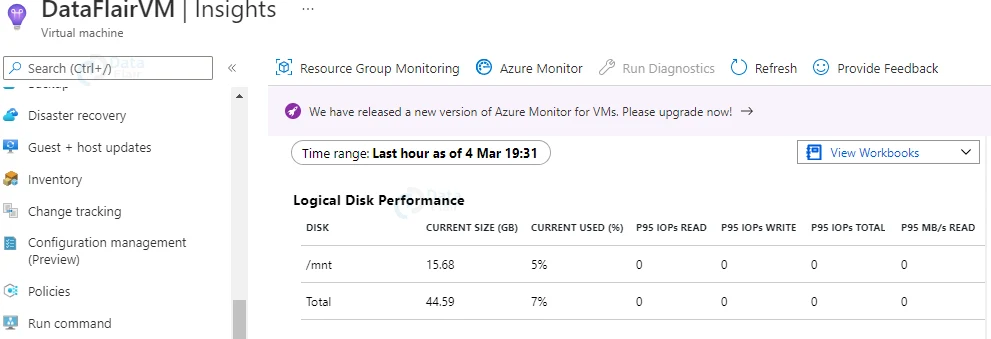
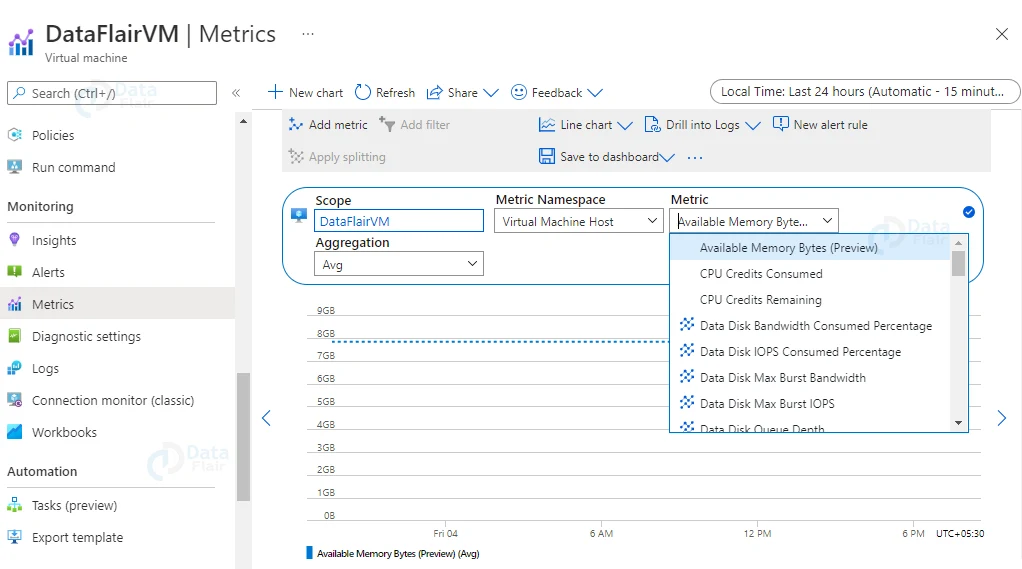
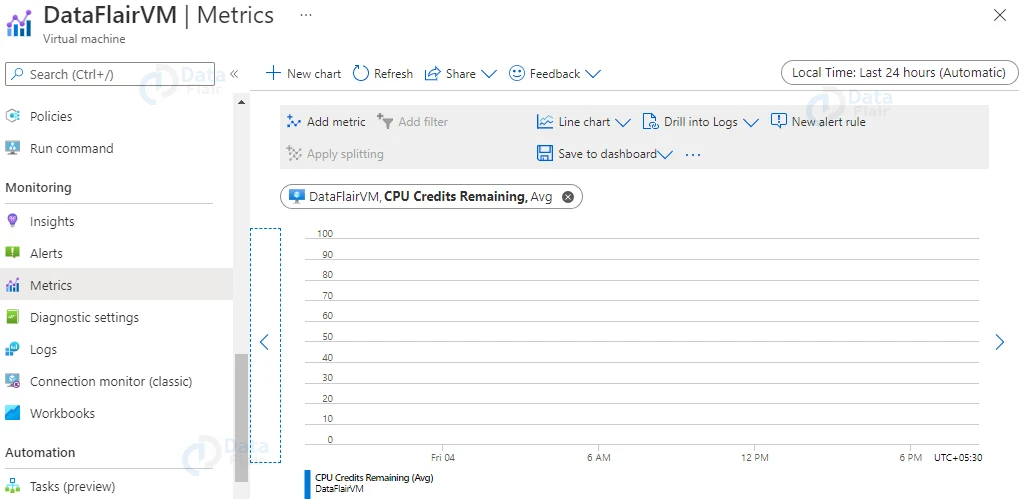
Analyzing Metrics in Azure
Metrics are numerical quantities that describe a system’s state at a given point in time. Although platform metrics for the virtual machine host are collected automatically, guest measurements require the installation of the Azure Monitor agent.
The Overview page contains the most popular host metrics, and the Information pane provides access to additional metrics.
You can use this tool to make charts out of metric information and visually correlate trends. You may also add a chart to an Azure dashboard or build a metric alert rule. See Analyze metrics for an Azure resource for a tutorial on how to use this tool.
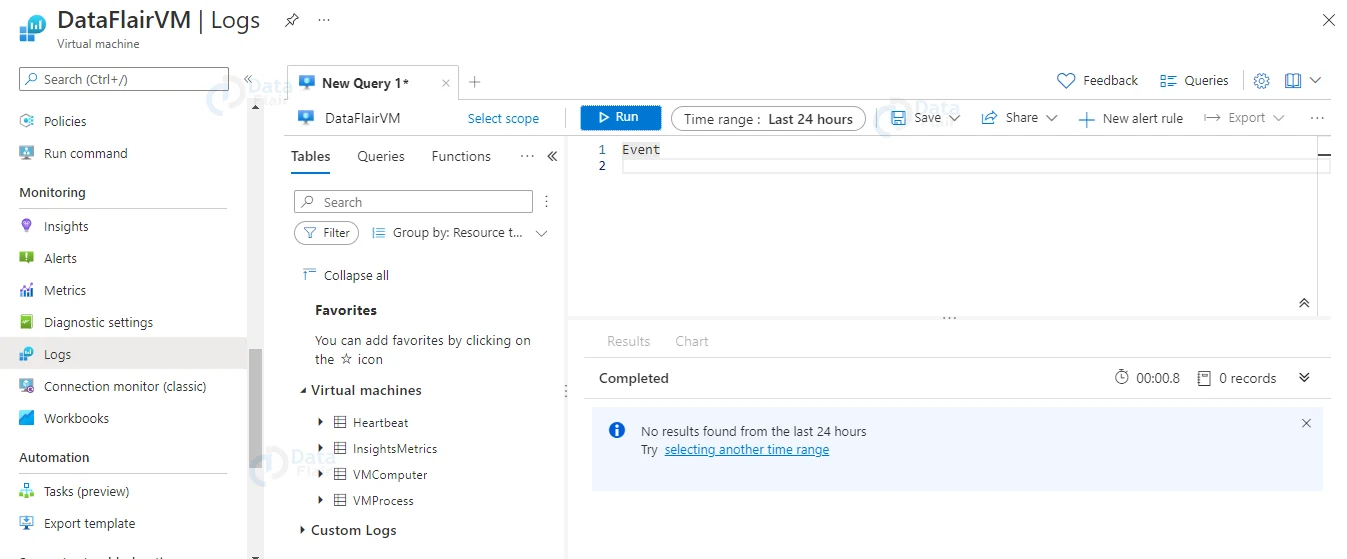
Analyzing Logs in Azure
Data from Azure Monitor Logs are saved in a Log Analytics workspace. Here it’s organized into tables with its own set of properties. The acquired data is stored in logs by VM insights. This also provide performance and map views that you can use to interactively study the data.
You can interact directly with this data to delve deeper or do custom analytics. See How to query logs from VM insights for more details and sample queries for this data.
Use log queries in Log Analytics to evaluate other log data collected from your virtual machines.
There are several built-in virtual machine queries to choose from, or you can design your own. You can work with the results of these searches interactively, save them to a worksheet and share them with others, or create alerts based on them.
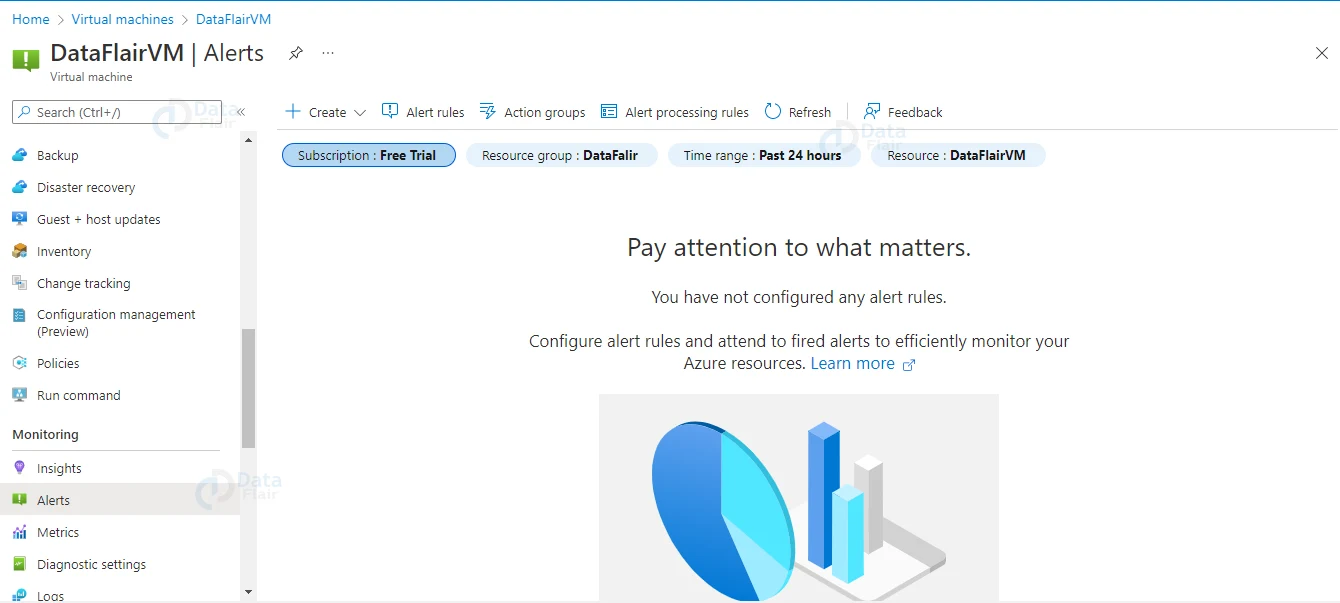
Alerts
When relevant conditions are discovered in your monitoring data, Azure Monitor notifications will notify you. These alerts can help you spot and fix problems in your system before they affect your consumers. On metrics, logs, and the activity log, you can set alerts.
Conclusion
It’s very important to monitor Azure virtual machines for availability, performance, and operation when you have key applications and business processes that rely on them. This article outlines the monitoring data generated by Azure virtual machines (VMs). It also covers how to examine and alert yourself about it using Azure Monitor’s features.
Your opinion matters
Please write your valuable feedback about DataFlair on Google


