How to Configure Alert Rules in Azure?
Top AWS Course for AWS Certified Cloud Practitioner (CLF-C01) Start Now!!
Job-ready Online Courses: Knowledge Awaits – Click to Access!
Today we will learn what are alerts and how one can set up alert rules in Azure. Alerts help us to set the limitation on the resources and will notify us if their usage is exceeded. So, without wasting time let us look at setting up alert rules in Azure. Let us begin.
What are Microsoft Azure alerts?
Using your monitoring data in Azure Monitor, alerts will warn you when issues with your infrastructure or application are discovered.
They let you detect and resolve problems before your system’s users are aware of them.
Alert rules are distinct from alerts and the activities conducted in response to an alert. The target and conditions for alerting are captured in the alert rule.
The status of the alert rule might be activated or disabled. Alerts are only activated when they are enabled.
The following are important characteristics of an alert rule:
Target Resource – Defines the alerting scope and signals provided. Any Azure resource can be used as a target. The following are some examples of targets:
- Virtual machines.
- Storage accounts.
- Log Analytics workspace.
- Application Insights.
You can specify several resources as the target of an alert rule for certain resources (such as virtual machines).
The target resource sends out a signal. Metrics, activity logs, Application Insights, and logs are all examples of signal types.
Criteria – A signal and logic combination applied to a target resource. Examples:
- Percentage CPU > 80%
- Server Response Time > 4 ms
- Result count of a log query > 100
Alert Name – A unique name for the alert rule that the user has created.
Alert Description – This is a description of the alert rule that the user has set up.
When the requirements given in the alert rule are met, the severity of the alert is determined. The severity scale goes from 0 to 4.
- Sev 0 = Critical
- Sev 1 = Error
- Sev 2 = Warning
- Sev 3 = Informational
- Sev 4 = Verbose
Action – A specific action will be taken when the alert is triggered
Alerts in Azure Monitor
The data collected by Azure monitor from our application and services are used by alerts in Azure monitor to warn administrators when an anomaly or issue based on particular thresholds is discovered. This allows us to take the appropriate steps to resolve the problem before the end-user becomes aware of it.
The following are the important attributes of an alert in Azure Monitor:
- Target resource
- Criteria
- Signal
- Alert name
- Severity
- Alert description
- Action
How to create alert rule on Virtual Machine in Azure
Below are the steps to create alert rule on a virtual machine in Azure:
1: Navigate to your virtual machine’s ‘Monitoring’ section.
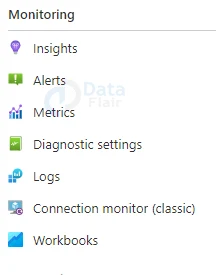
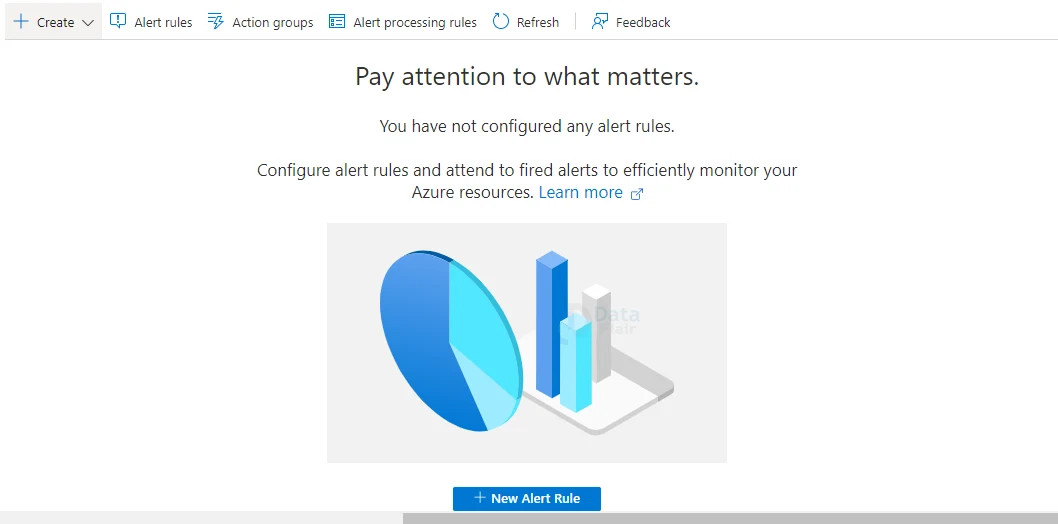
2: To add a new alert, go to the Alerts menu and select + New alert rule.
3: Next, click Select scope to choose a resource for which we want to receive an alert. To find a resource, we simply type its name into the search bar.
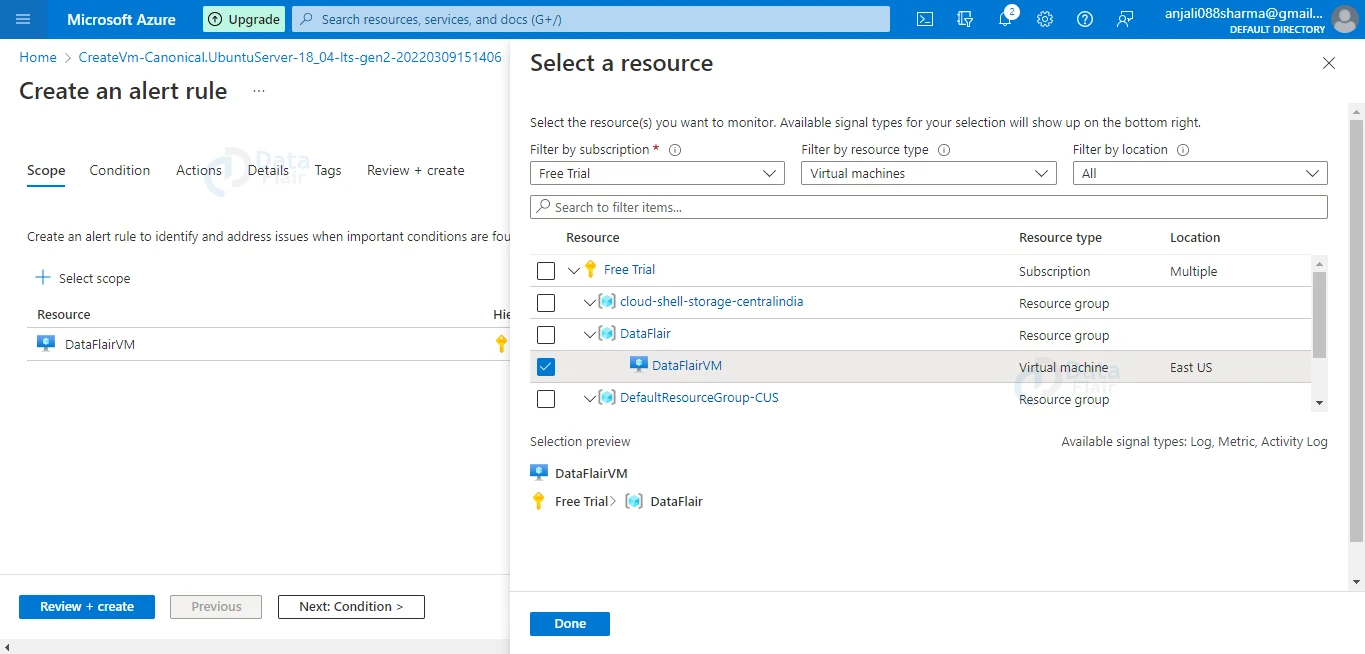
4: If the selected target resource provides metrics for which we may produce alerts, those metrics will be included in the accessible signals on the bottom right. This aids us in selecting the appropriate target resource for our requirements.
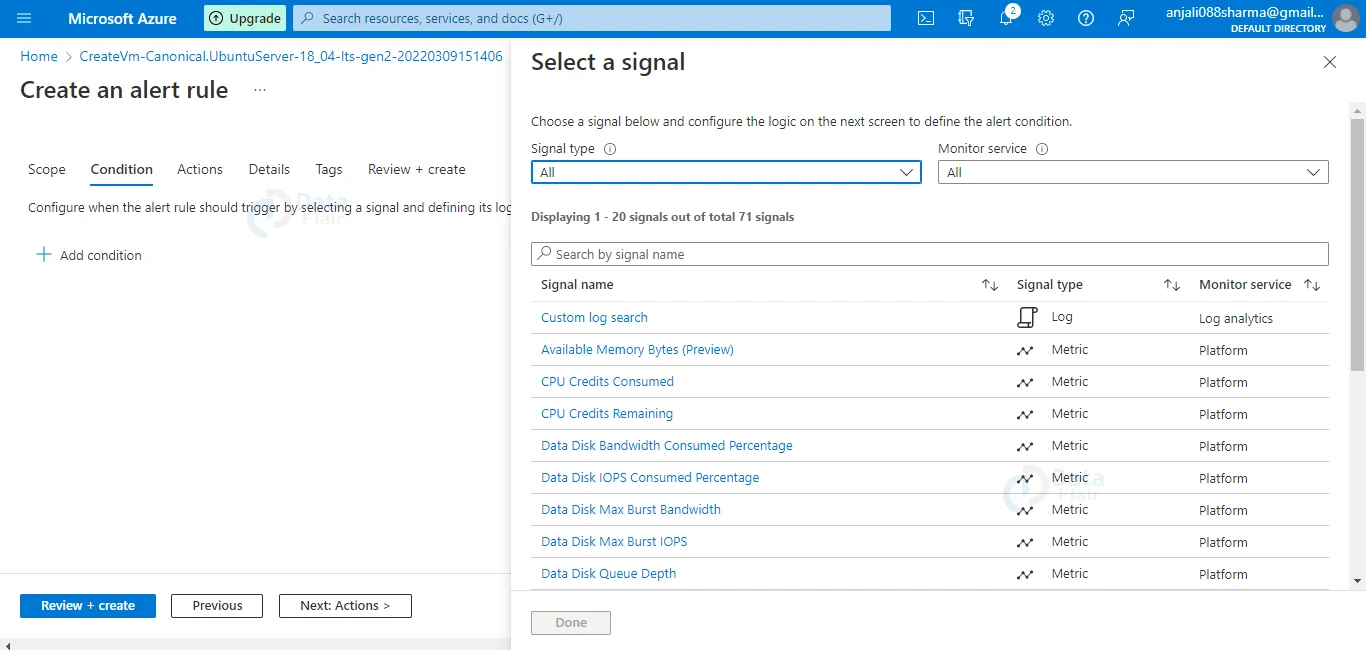
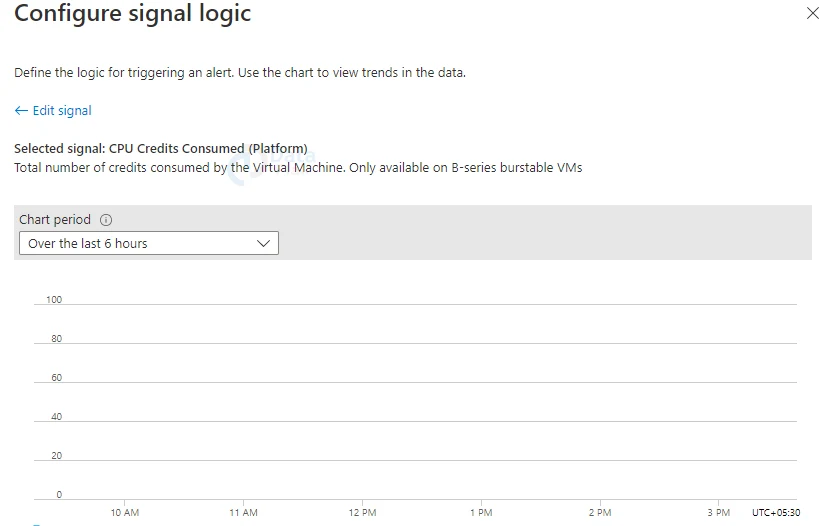
5: After we’ve chosen a target resource, we can use the Add condition option to see a list of signals that the resource supports ( signals are of the following types: metric, activity log, Application Insights, and log). Choose the measure for which we want to set up an alert.
6: By default, it will show a chart for the target resource’s chosen statistic for the previous six hours. We can use the chart period dropdown to get a long history for the statistic.
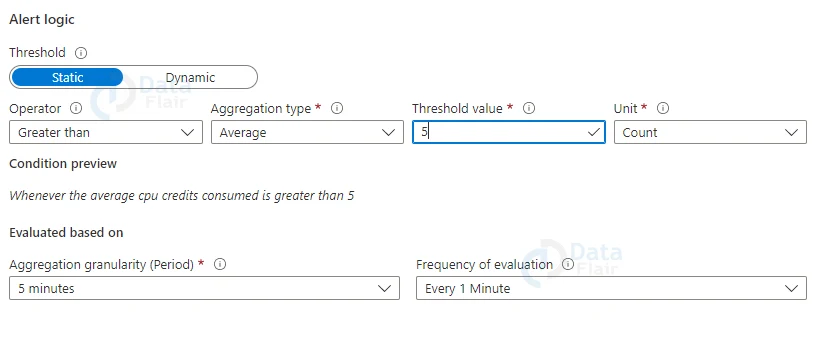
7: Finally, pick the threshold type, operator, and aggregate type, as well as the threshold value/sensitivity based on the threshold type chosen, to set the logic that the metric alert rule will analyze and activate.
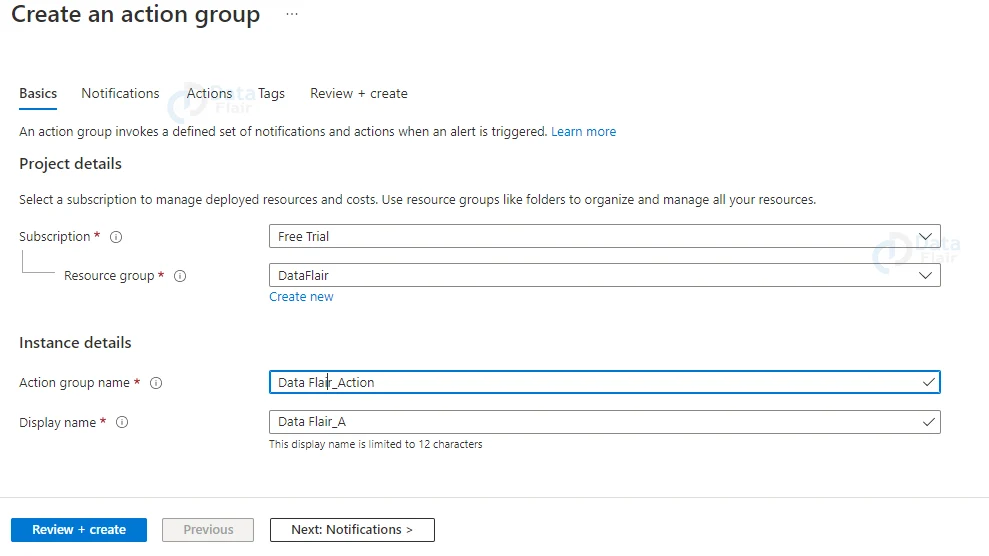
8: If you already have an action group, you can add it to the alert rule by clicking Add action group.

9: If your subscription doesn’t already have an action group to choose from, click Create action group to make one. Give the action group a Subscription and Resource group, as well as an Action group name that will display on the portal and a Display name that will appear in email and SMS notifications.
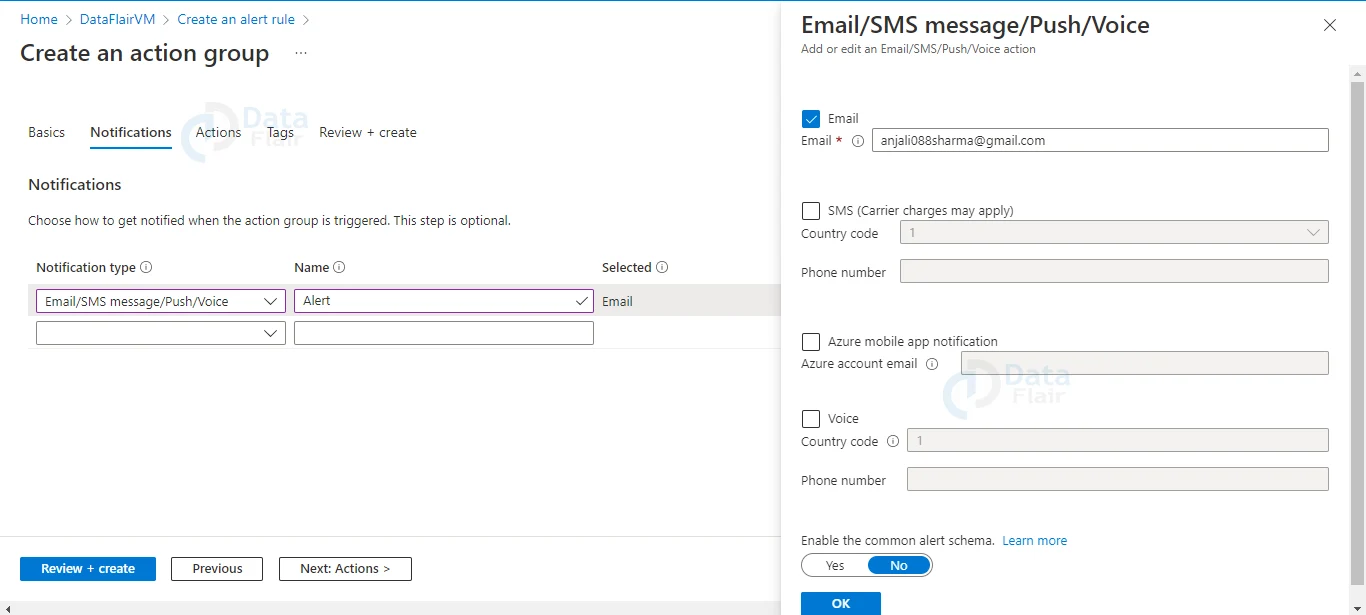
10: When the alert is fired, go to Notifications and add one or more methods to notify the right persons.
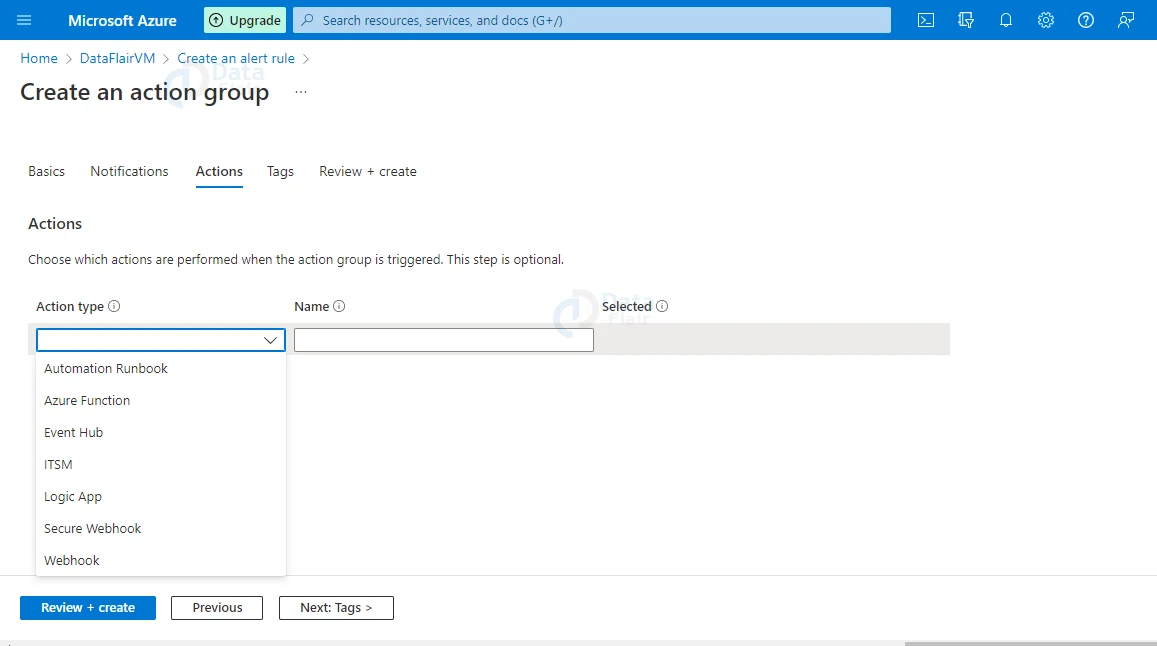
11: The next section is Actions, where we can choose from a variety of action types or leave the options blank. When an action group is activated, actions are taken. Now, Select Next Tags from the drop-down menu.
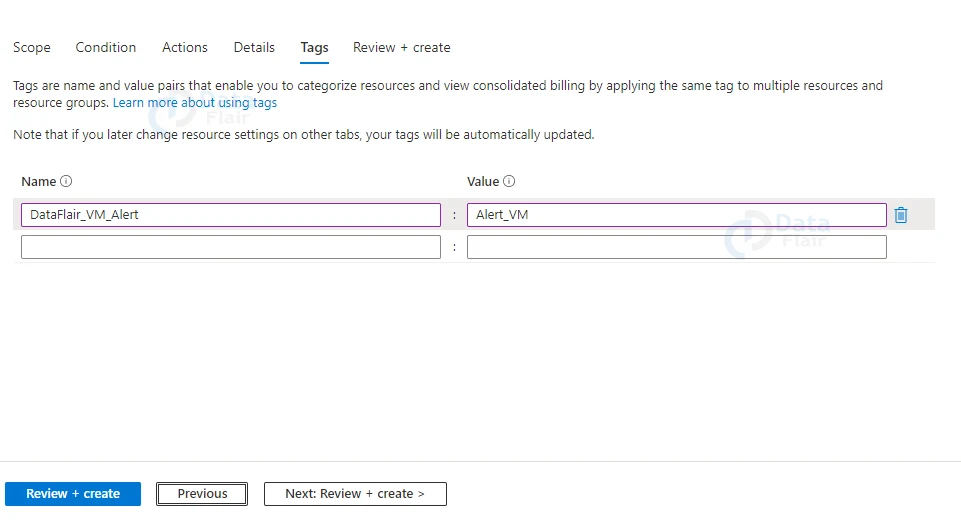
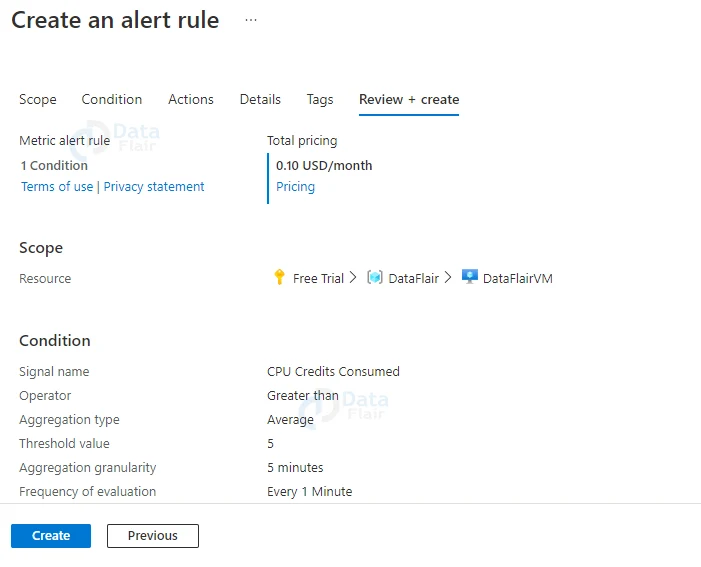
12: Give the name of the key and its value. Select Next Review + Create from the drop-down menu.
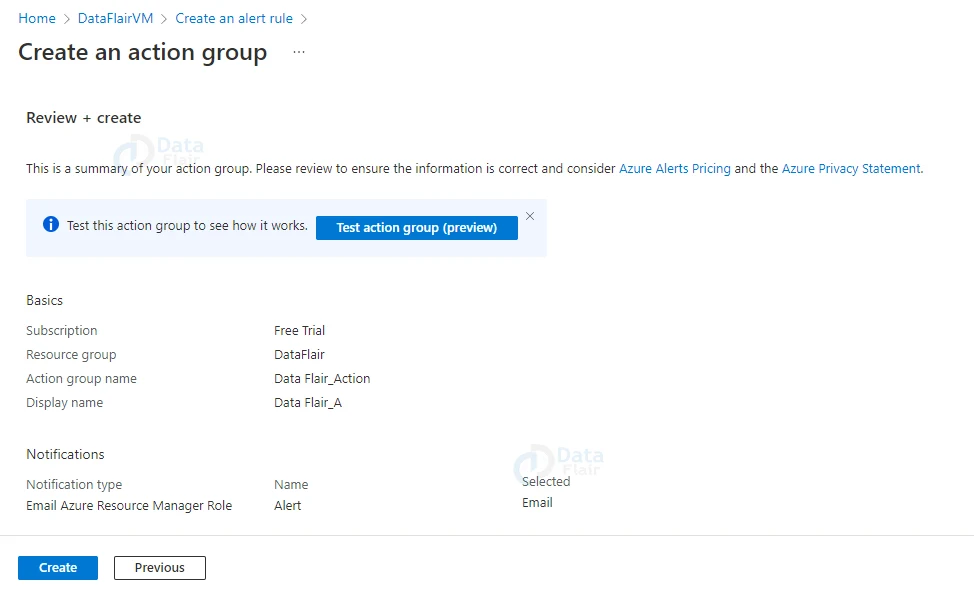
13: Click on the Create button.
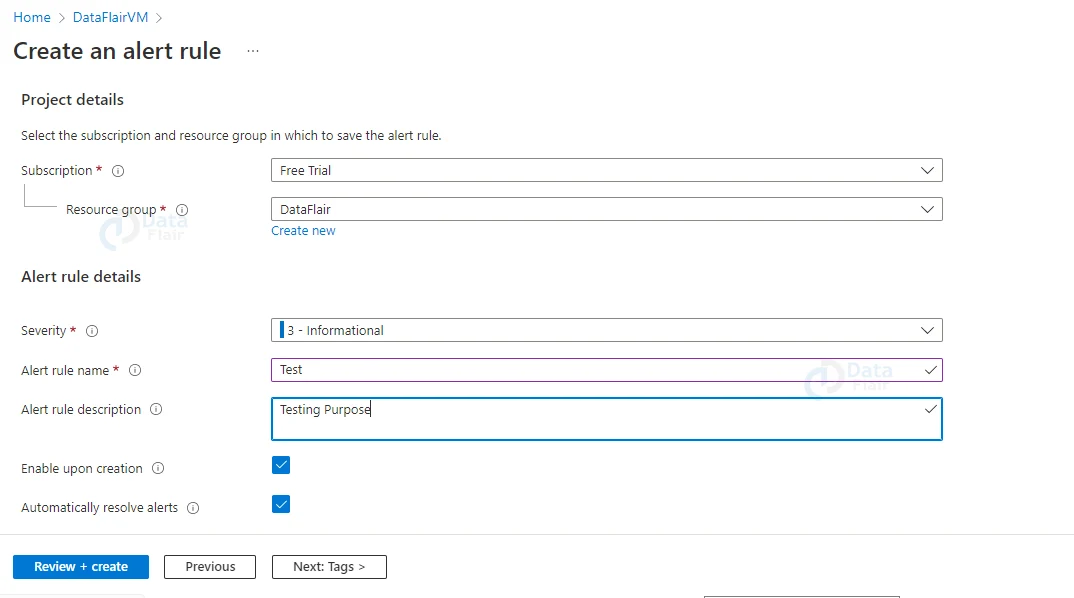
14: Next, provide the name of the alert rule, the alert description, the subscription id, and the resource group.
15: Choose the Severity.
For example:
- Sev 0 = Critical
- Sev 1 = Error
- Sev 2 = Warning
- Sev 3 = Informational
- Sev 4 = Verbose.
16: Now, click on create alert rule.
17: Once again provide appropriate tags.
18: Lastly, hit the Review and Create button.
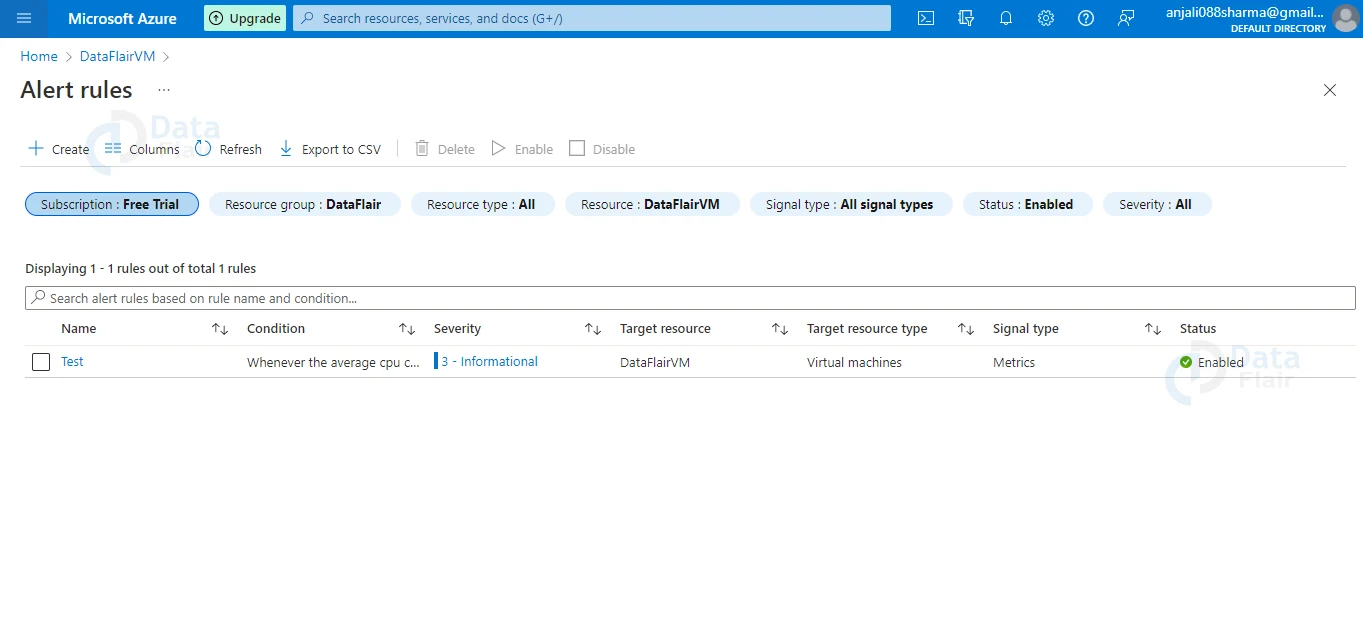
19: After some time has passed, the alert will be ready. Go to the Alert home page and check the alert rule. If an alarm is triggered, we will receive an alert email. Check your email account for the alert email.
Alert Types in Azure
Now, let us have a look at the various Alert Types in Azure. They are as follows:
1. Azure Metric Alerts
Metric alerts are used to keep an eye on Azure resources on a regular basis. At regular intervals, Azure Monitor runs metric alert trigger conditions.
Azure Monitor sends a notification when the evaluation is true. Metric alerts are stateful, and Azure Monitor will only deliver a message if all of the conditions are met.
Metric alerts are important if you need to know when your server’s CPU utilization reaches a crucial level of 90%, for example. You can be notified if your database storage is running low or if network latency is approaching unacceptably high levels.
2. Azure Log Alerts
Log alerts examine rule logic and, if appropriate, issue an alarm using log data. Any Azure resource, such as server logs, application server logs, or application logs, can provide this information.
Because log data is historical by definition, its use is limited to analytics and trends.
These logs can be used to see whether any of your servers have exceeded a certain threshold for CPU use in the last 30 minutes.
You may also look at the response codes that your web application server has issued in the last hour.
3. Azure Activity Log Alerts
You can set up activity log alerts to be notified when a specific event occurs on an Azure resource.
You can be notified when someone starts a new VM in a subscription, for example. Alerts for Azure service health can also be included in an activity log.
Azure resources are supported via activity log notifications.
This sort of a log is typically used to receive notifications when specific modifications to a resource in your Azure subscription occur.
Designing an Azure Alert Rule in the Azure Portal
When creating new alert rules, there is no better way to understand the impact of your existing rules than to use the Azure Portal. With the historical data you have, you can quickly examine the rule’s effect and whether it would have triggered as planned.
The UI is extremely useful for defining the signal logic for the alert rule. You can see right away that there have been multiple instances in the last few hours where the alarm would have activated – proving that the logic works.
After you’ve defined the rule, go to Azure Monitor’s “Alert Rules” section and click on your new rule, then “Properties”.
You may easily export your Alert Rule as an ARM template from there. The data is in JSON format, and it will serve as the foundation for our new Bicep alert rule template.
Converting the ARM alert rule to Bicep
You can use Bicep to convert the newly exported JSON template. After the conversion is complete, we can make any changes to the code that we see fit and commit them to our code repository.
Here’s a quick rundown on how to use the Bicep CLI to convert a JSON file to Bicep:
az bicep decompile -f theARMfile.json
Bicep Alert Rule
After you’ve converted the ARM template to a Bicep file, you’ll need to make any necessary changes for your individual situation before deploying it.
To make it work for this blog post while also working to deploy to any of my Azure subscriptions, we changed the names of parameters and other values.
This is a basic Bicep file that defines an Alert Rule for one of my Azure resources. It is assumed that a Web App and an Action Group are already in place to monitor. Of course, you can make those with Bicep as well.
resource symbolicname 'Microsoft.Insights/alertrules@2016-03-01' = {
  name: ‘value'
  location: 'value'
  tags: {
    tagName1: 'tagValue1'
    tagName2: 'tagValue2'
  }
  properties: {
    action: {
  	odata.type: 'string'
  	// For remaining properties, see RuleAction objects
    }
    actions: [
  	{
    	odata.type: 'string'
    	// For remaining properties, see RuleAction objects
  	}
    ]
    condition: {
  	dataSource: {
    	legacyResourceId: 'value'
    	metricNamespace: 'value'
   	 resourceLocation: 'value'
    	resourceUri: 'value'
    	odata.type: 'value'
    	// For remaining properties, see RuleDataSource objects
  	}
  	odata.type: 'value'
  	// For remaining properties, see RuleCondition objects
    }
    description: 'value'
    isEnabled: bool
    name: 'value'
    provisioningState: 'value'
  }
}
Conclusion
Thus, we are at the final section of our article. And, in this article, we learnt about Alerts in Azure along with a demo. We hope you enjoyed this article too and will be further with us in our Azure series.
If you are Happy with DataFlair, do not forget to make us happy with your positive feedback on Google


