

Python course with 57 real-time projects - Learn Python
1. Objective
In our last session, we discussed Data Preprocessing, Analysis & Visualization in Python ML. Now, in this tutorial, we will learn how to split a CSV file into Train and Test Data in Python Machine Learning. Moreover, we will learn prerequisites and process for Splitting a dataset into Train data and Test set in Python ML.
So, let’s begin How to Train & Test Set in Python Machine Learning.
Train and Test Set in Python Machine Learning – How to Split
2. Training and Test Data in Python Machine Learning
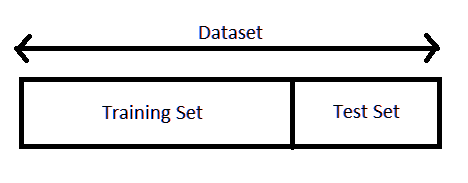
As we work with datasets, a machine learning algorithm works in two stages. We usually split the data around 20%-80% between testing and training stages. Under supervised learning, we split a dataset into a training data and test data in Python ML.
Train and Test Set in Python Machine Learning
a. Prerequisites for Train and Test Data
We will need the following Python libraries for this tutorial- pandas and sklearn.
We can install these with pip-
pip install pandas
pip install sklearn
We use pandas to import the dataset and sklearn to perform the splitting. You can import these packages as-
>>> import pandas as pd
>>> from sklearn.model_selection import train_test_split
>>> from sklearn.datasets import load_iris
Do you Know about Python Data File Formats – How to Read CSV, JSON, XLS
3. How to Split Train and Test Set in Python Machine Learning?
Following are the process of Train and Test set in Python ML. So, let’s take a dataset first.
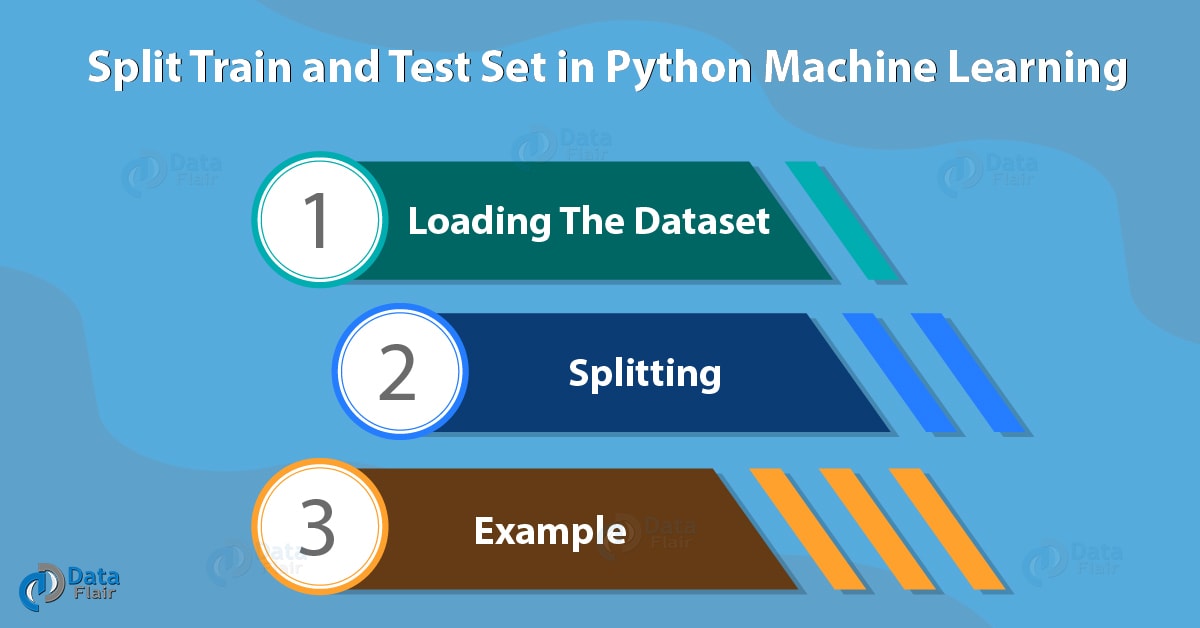
How to Split Train and Test Set in Python Machine Learning
a. Loading the Dataset
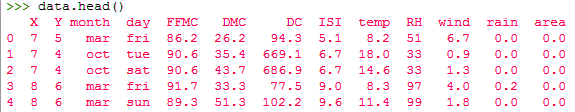
Let’s load the forestfires dataset using pandas.
>>> data=pd.read_csv('forestfires.csv')
>>> data.head()
Train and Test Set in Python Machine Learning
b. Splitting
Let’s split this data into labels and features. Now, what’s that? Using features, we predict labels. I mean using features (the data we use to predict labels), we predict labels (the data we want to predict).
>>> y=data.temp
>>> x=data.drop('temp',axis=1)
Temp is a label to predict temperatures in y; we use the drop() function to take all other data in x. Then, we split the data.
>>> x_train,x_test,y_train,y_test=train_test_split(x,y,test_size=0.2)
>>> x_train.head()
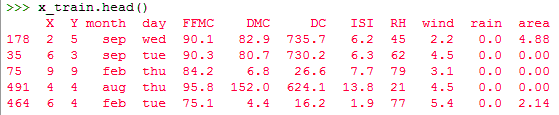
Train and Test Set in Python Machine Learning
>>> x_train.shape
(413, 12)
Do you Know How to Work with Relational Database with Python
>>> x_test.head()
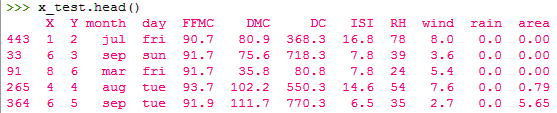
Train and Test Set in Python Machine Learning
>>> x_test.shape
(104, 12)
The line test_size=0.2 suggests that the test data should be 20% of the dataset and the rest should be train data. With the outputs of the shape() functions, you can see that we have 104 rows in the test data and 413 in the training data.
c. Another Example
Let’s take another example. We’ll use the IRIS dataset this time.
>>> iris=load_iris()
>>> x,y=iris.data,iris.target
>>> x_train,x_test,y_train,y_test=train_test_split(x,y,
train_size=0.5,
test_size=0.5,
random_state=123)
>>> y_test
array([1, 2, 2, 1, 0, 2, 1, 0, 0, 1, 2, 0, 1, 2, 2, 2, 0, 0, 1, 0, 0, 2,
0, 2, 0, 0, 0, 2, 2, 0, 2, 2, 0, 0, 1, 1, 2, 0, 0, 1, 1, 0, 2, 2,
2, 2, 2, 1, 0, 0, 2, 0, 0, 1, 1, 1, 1, 2, 1, 2, 0, 2, 1, 0, 0, 2,
1, 2, 2, 0, 1, 1, 2, 0, 2])
>>> y_train
array([1, 1, 0, 2, 2, 0, 0, 1, 1, 2, 0, 0, 1, 0, 1, 2, 0, 2, 0, 0, 1, 0,
0, 1, 2, 1, 1, 1, 0, 0, 1, 2, 0, 0, 1, 1, 1, 2, 1, 1, 1, 2, 0, 0,
1, 2, 2, 2, 2, 0, 1, 0, 1, 1, 0, 1, 2, 1, 2, 2, 0, 1, 0, 2, 2, 1,
1, 2, 2, 1, 0, 1, 1, 2, 2])
Let’s explore Python Machine Learning Environment Setup
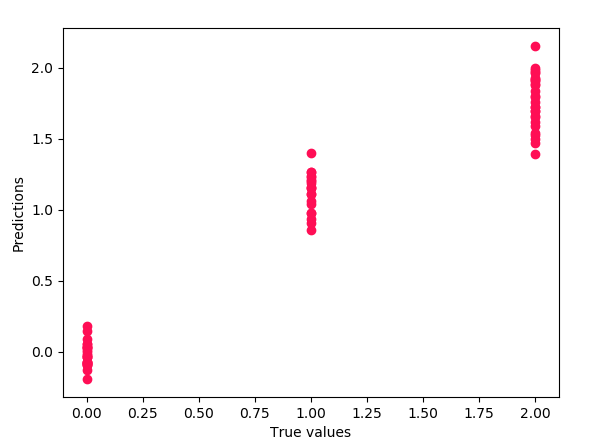
4. Plotting of Train and Test Set in Python
We fit our model on the train data to make predictions on it. Let’s import the linear_model from sklearn, apply linear regression to the dataset, and plot the results.
>>> from sklearn.linear_model import LinearRegression as lm
>>> model=lm().fit(x_train,y_train)
>>> predictions=model.predict(x_test)
>>> import matplotlib.pyplot as plt
>>> plt.scatter(y_test,predictions)
<matplotlib.collections.PathCollection object at 0x0651CA30>
>>> plt.xlabel('True values')
Text(0.5,0,’True values’)
>>> plt.ylabel('Predictions')
Text(0,0.5,’Predictions’)
Read about Python NumPy – NumPy ndarray & NumPy Array
>>> plt.show()
Train and Test Set in Python Machine Learning
0.9396299518034936
So, this was all about Train and Test Set in Python Machine Learning. Hope you like our explanation.
5. Conclusion
Today, we learned how to split a CSV or a dataset into two subsets- the training set and the test set in Python Machine Learning. We usually let the test set be 20% of the entire data set and the rest 80% will be the training set. Furthermore, if you have a query, feel to ask in the comment box.
Related Topic- Python Geographic Maps & Graph Data
For reference