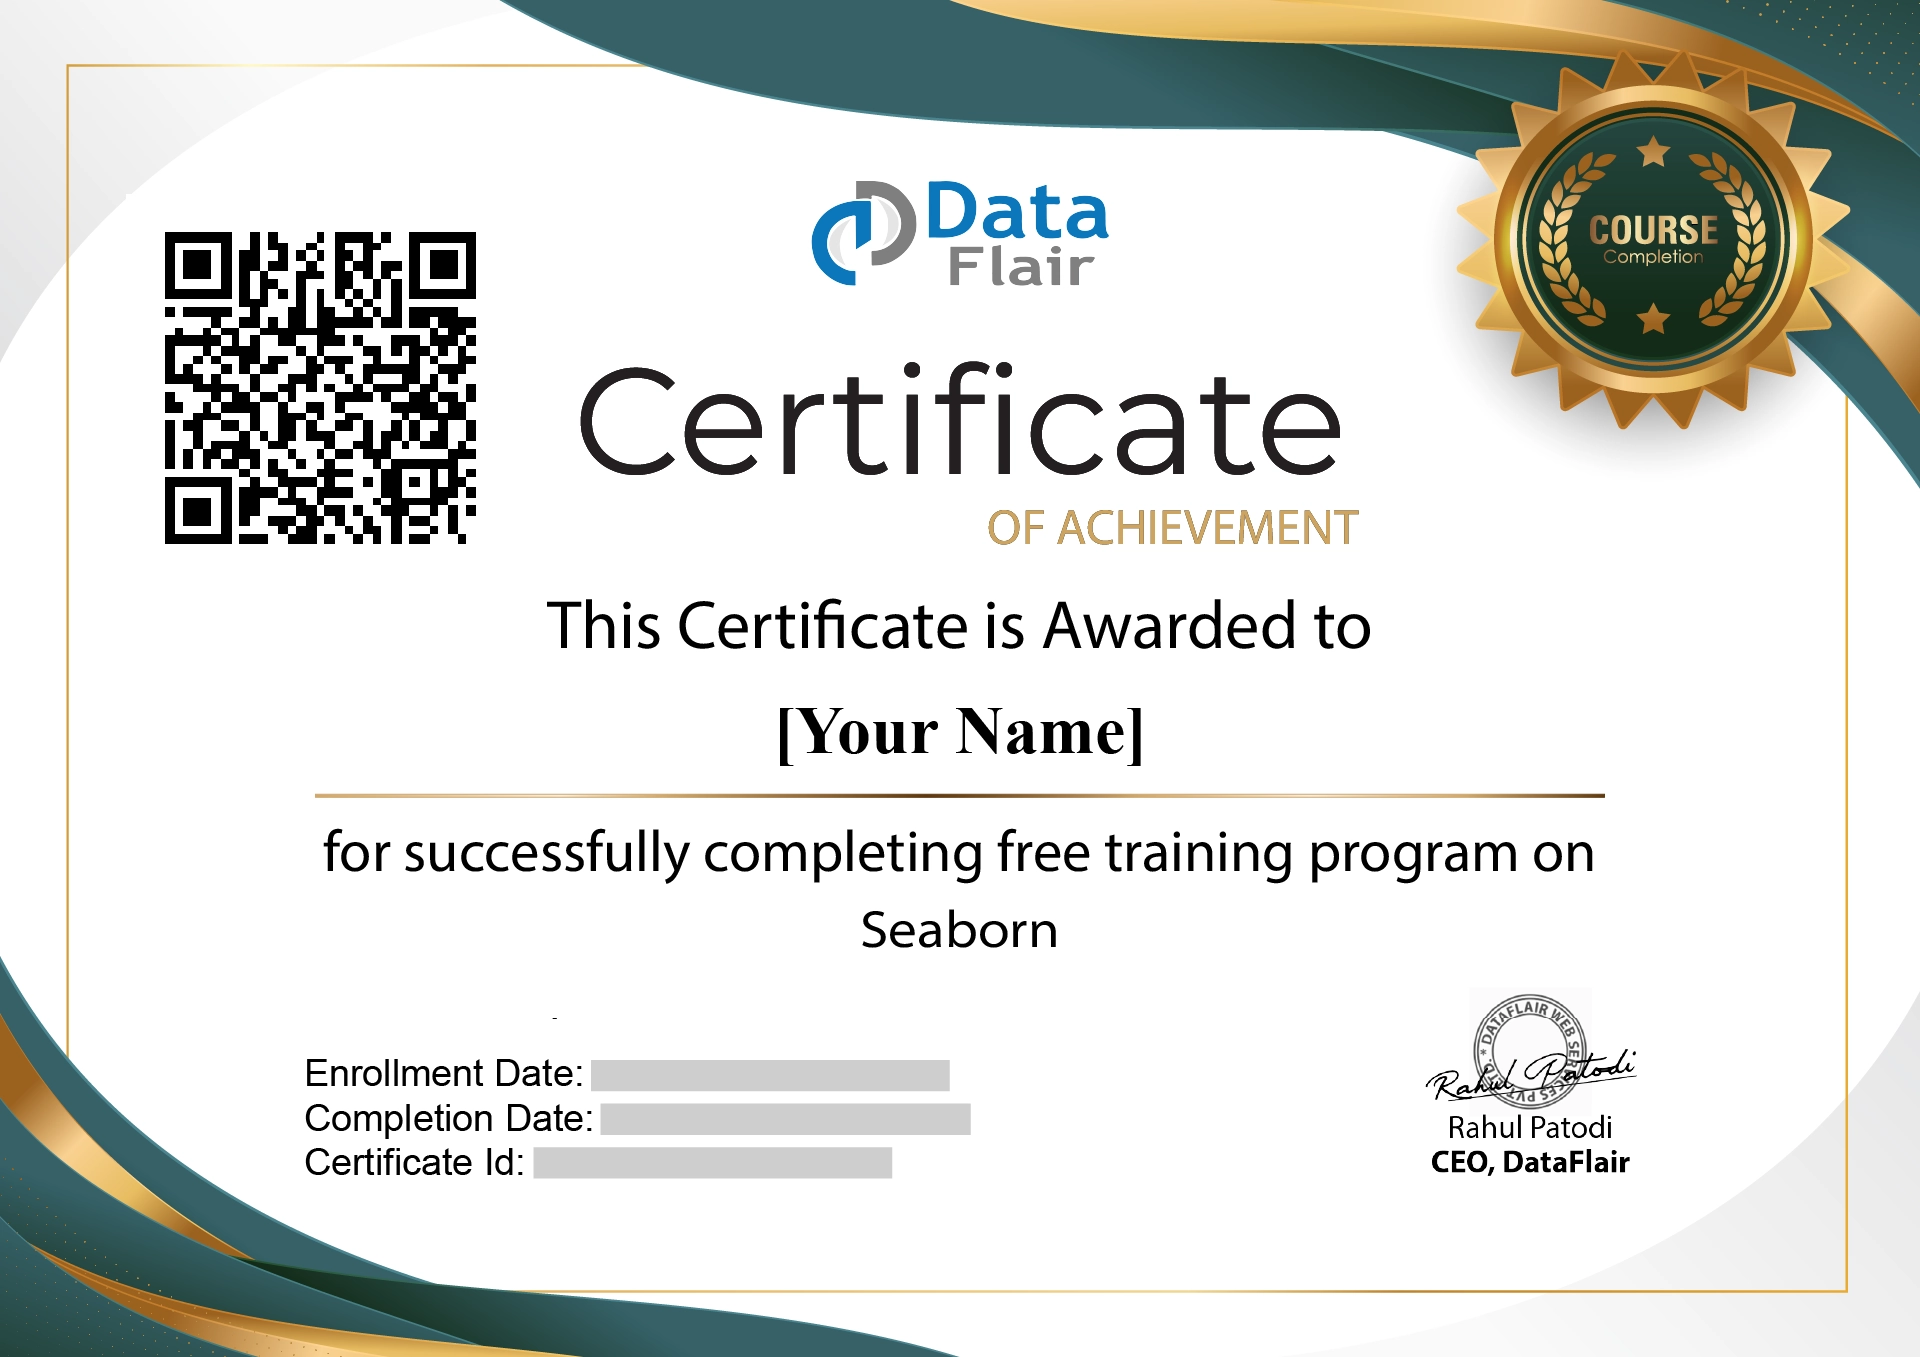
Free Seaborn Course for Beginners with Certificate [Hindi]

“Cracking the Pre-Placement Offer: My Machine Learning Journey with DataFlair TechVidvan.”
By the time I reached my fourth year, I decided to upskill in Machine Learning, but the real challenge was finding the right approach. I didn’t just want theoretical knowledge; I wanted to get hands on…Read more
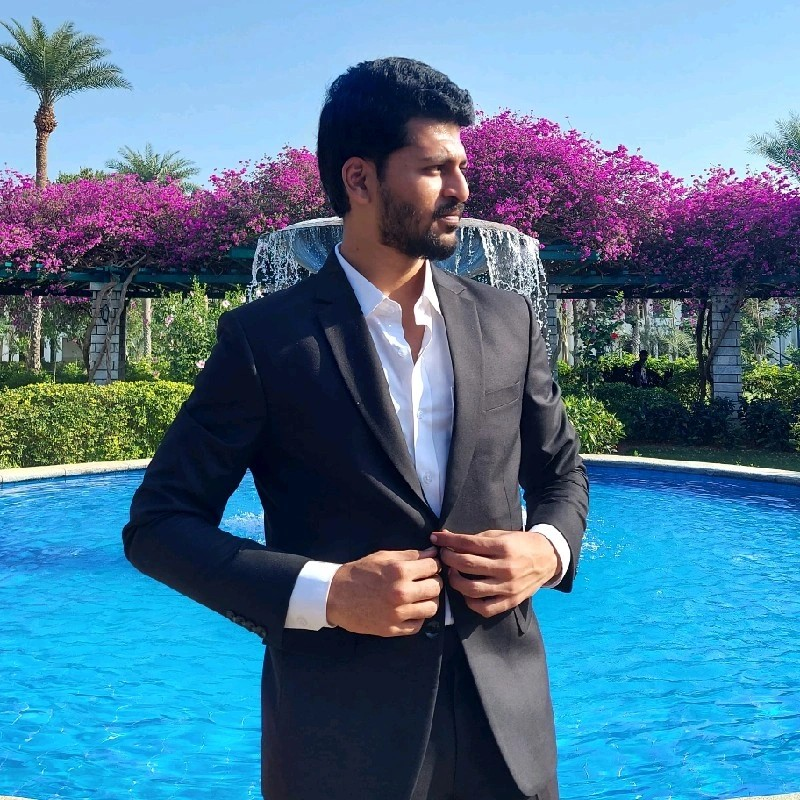
Gopi Kiran 
Got placed in Course5Intelligence
“From Software Engineer to Data Engineer: My Journey to Walmart with DataFlair TechVidvan.”
When I decided to upskill, I explored multiple learning platforms, but most were too theoretical or lacked real-world relevance. That’s when I came across TechVidvan. I learnt Data Engineering from Rahul sir…Read more

Nishchay Agrawal
Data Engineer at Walmart
“Never stop exploring your potential—one small step can lead to a huge transformation.”
Our instructor was approachable and patient. They addressed everyone’s doubts and simplified tough ideas with real-world references. That supportive environment motivated me to stay…Read more
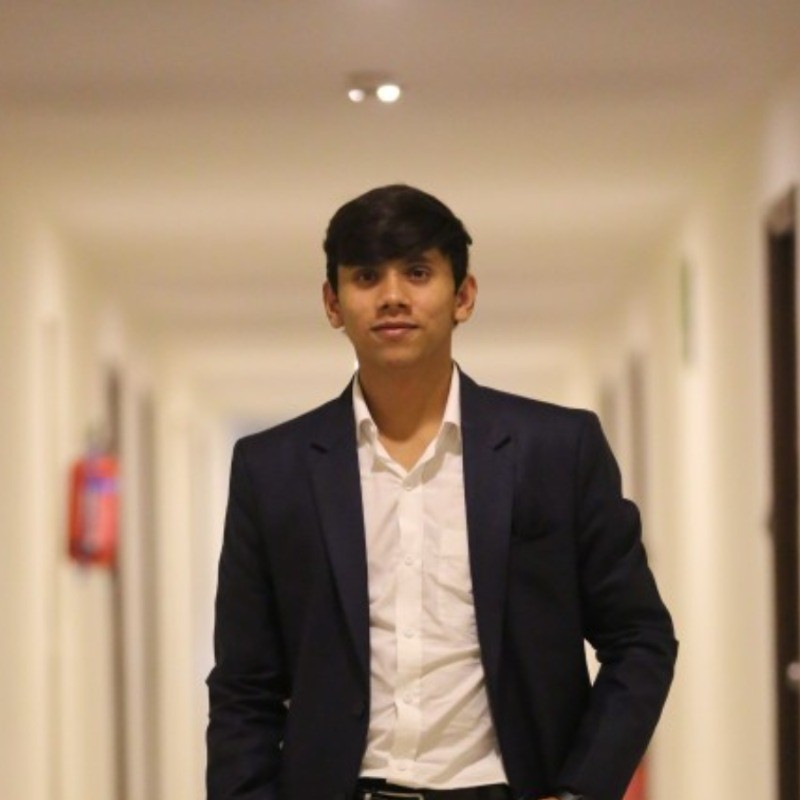
Tanishque Agrawal
Executive Research & Development at CG Power and Industrial Solutions Limited
“If you wish a bright future ahead, upgrade your skills and shift your career from mainframe to Big Data before its too late.”
I got the best mentor ever who has enriched knowledge of Big Data and the industry. He used to explain all the concepts with real-life examples and after the completion of each topic…Read more

Aniket Singh
Big Data Developer at SmartData Technologies
“Keep learning as the desire to learn never ends till your last day.”
While searching for a full-fledged Big Data course, I surveyed for many institutions and finally landed up at DataFlair. The instructor is extremely helpful in taking students to the expert level. He kept motivating me to learn more and more…Read more
Prerna Raikwar
Data Science Engineer, Cisco
“Breaking into Tech: My Journey from Learning C/C++ to Becoming a System Engineer at TCS.”
The hands-on approach, expert mentorship, and well-structured course on C/C++ and DSA at TechVidvan caught my attention. I also interned at DataFlair after learning to gain a better understanding….Read more

Satchit R
System Engineer at TCS