


Master Python with 70+ Hands-on Projects and Get Job-ready - Learn Python
Data can be messy, but today we’re learning how to clean it up visually.
We have already explored 3D visuals, but today we’re getting back to learning something interesting and important. We’ll show you how to use Matplotlib to build clean, professional Scatter Plots and Box Plots. These are the most common charts you’ll see in the real world because it makes them easy to read.
In our Last tutorial, we discussed Python Charts – Bubble & 3D Charts. Today, we will talk about Python Scatter Plot. In addition, we will learn how to draw a Scatter Plot in Python Programming. Moreover, we will cover how to create a Python Box Plot using Matplotlib.
Let’s begin the Python Scatter Plot.
How to Create a Python Box Plot Using Matplotlib?
Python box plot tells us how distributed a dataset is. Another use is to analyze how distributed data is across datasets. Such a plot creates a box-and-whisker plot and summarizes many different numeric variables. Let’s first take an example so we can explain its structure better.
>>> import matplotlib.pyplot as plt
>>> np.random.seed(10)
>>> one=np.random.normal(100,10,200)
>>> two=np.random.normal(80, 30, 200)
>>> three=np.random.normal(90, 20, 200)
>>> four=np.random.normal(70, 25, 200)
>>> to_plot=[one,two,three,four]
>>> fig=plt.figure(1,figsize=(9,6))
>>> ax=fig.add_subplot(111)
>>> bp=ax.boxplot(to_plot)
>>> fig.savefig('boxplot.png',bbox_inches='tight')
Top 35 Python Interview Questions and Answer
This saves the following figure-

Creating Python BoxPlot (Using Matplotlib)
Structure-
- The box denotes the dataset’s quartiles.
- The whiskers extend and denote the rest of the distribution.
- A function of the inter-quartile range determines the points that are outliers.
The input to this can be a list, a NumPy array, a pandas Series object, an array, a list of vectors, a long-form DataFrame, or a wide-form DataFrame.
Let’s take another example.
>>> ax = sn.boxplot(x="day", y="total_bill", hue="smoker",data=tips, palette="Set3")
>>> plt.show()

Creating Python BoxPlot (Using Matplotlib)
How to Create a Python Scatter Plot?
Python Scatter Plot, let us denote how two or more objects are related to each other.

How to Create a Scatter Plot in Python?
It also lets us identify outliers- values that stray from all others.
>>> np.random.seed(19680801)
>>> N=50
>>> x=y=colors=np.random.rand(N)
>>> area = (30 * np.random.rand(N))**2
>>> plt.scatter(x, y, s=area, c=colors, alpha=0.5)
<matplotlib.collections.PathCollection object at 0x095BB6D0>
Do you know how to implement a Python Switch Case Statement
>>> plt.show()

Creating a Scatter Plot in Python using plt.plot
a. Python Scatter Plot using plt.plot
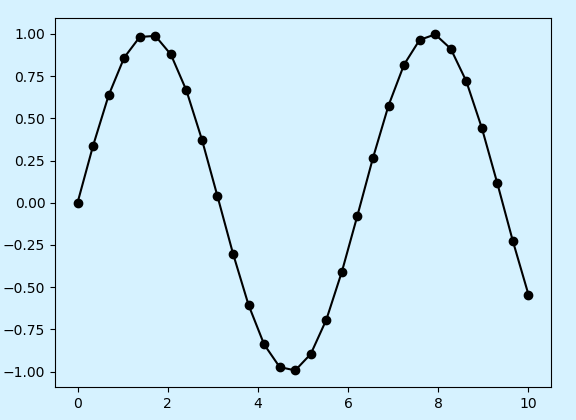
>>> x=np.linspace(0,10,30)
>>> from scipy import sin
>>> y=np.sin(x)
>>> plt.plot(x,y,'o',color='purple')
[<matplotlib.lines.Line2D object at 0x080D3890>]
>>> plt.show()

Creating Scatter Plot in Python using plt.plot
>>> plt.plot(x,y,'-ok')
[<matplotlib.lines.Line2D object at 0x08094F30>]
>>> plt.show()
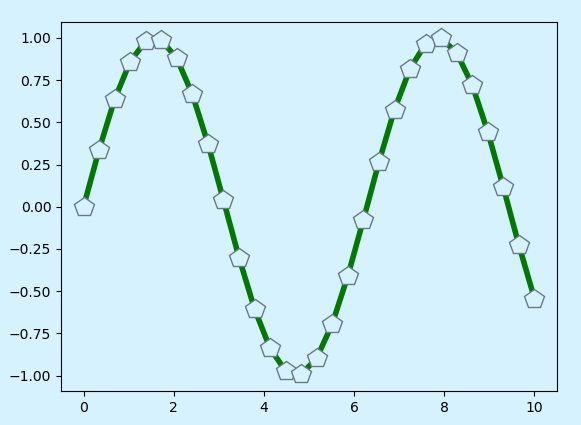
Python Scatter Plot using plt.plot
>>> plt.plot(x,y,'-p',color='green',
     markersize=15,linewidth=4,
     markerfacecolor='white',
     markeredgecolor='gray',
     markeredgewidth=1)
[<matplotlib.lines.Line2D object at 0x0811A4B0>]
Do you know how to Python Rename File – Single & Multiple Files
>>> plt.show()
Draw Python Scatter Plots | Python BoxPlot (Using Matplotlib)
b. More than one plot
>>> plt.plot(np.random.rand(20),'*')
[<matplotlib.lines.Line2D object at 0x08158A30>]
>>> plt.plot(np.random.rand(20),'o')
[<matplotlib.lines.Line2D object at 0x08158D90>]D
>>> plt.show()
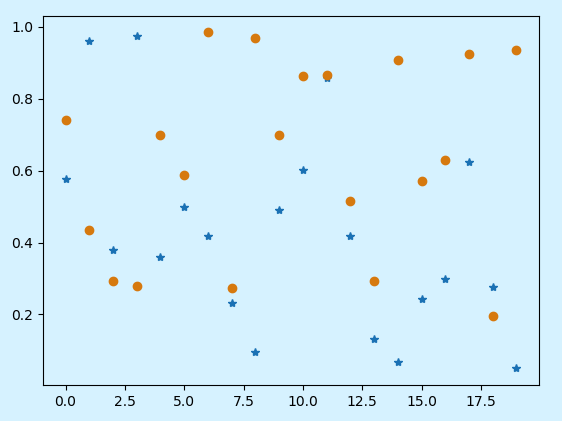
Draw More than one Scatter Plot in Python
So, this was all about Python Scatter Plot. Hope you like our explanation.
Conclusion
Hence, we learned how to create Python box plots and scatter plots with matplotlib. Stay tuned for more charts. Leave your opinions in the comments below.
Combining box plots and scatter plots in your analysis can give a complete picture of your data. For example, while a box plot might show that a group has high variance, a scatter plot could reveal whether that variance is random or follows a pattern. Python makes it easy to build, customize, and save them as high-quality images for presentations or reports.
Related Topic- Python Stemming and Lemmatization
For reference