


Machine Learning courses with 110+ Real-time projects Start Now!!
Do you want to be a data scientist? “The world is one Big Data problem’ – Andrew McAfee. In this world of data, reasons to want to become a Data Scientist could be many, ranging from money and honor to a quest for solving problems and making the world a better place.
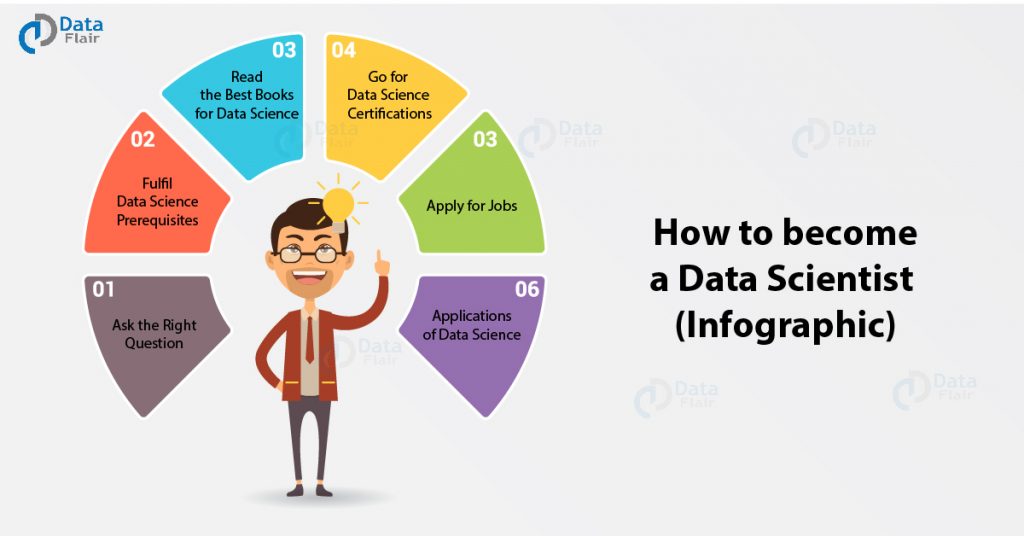
If you truly long to be one of them and trust you have what it takes to be one, then this post “Data Scientist Infographic” is for you.
Data Scientist Infographic
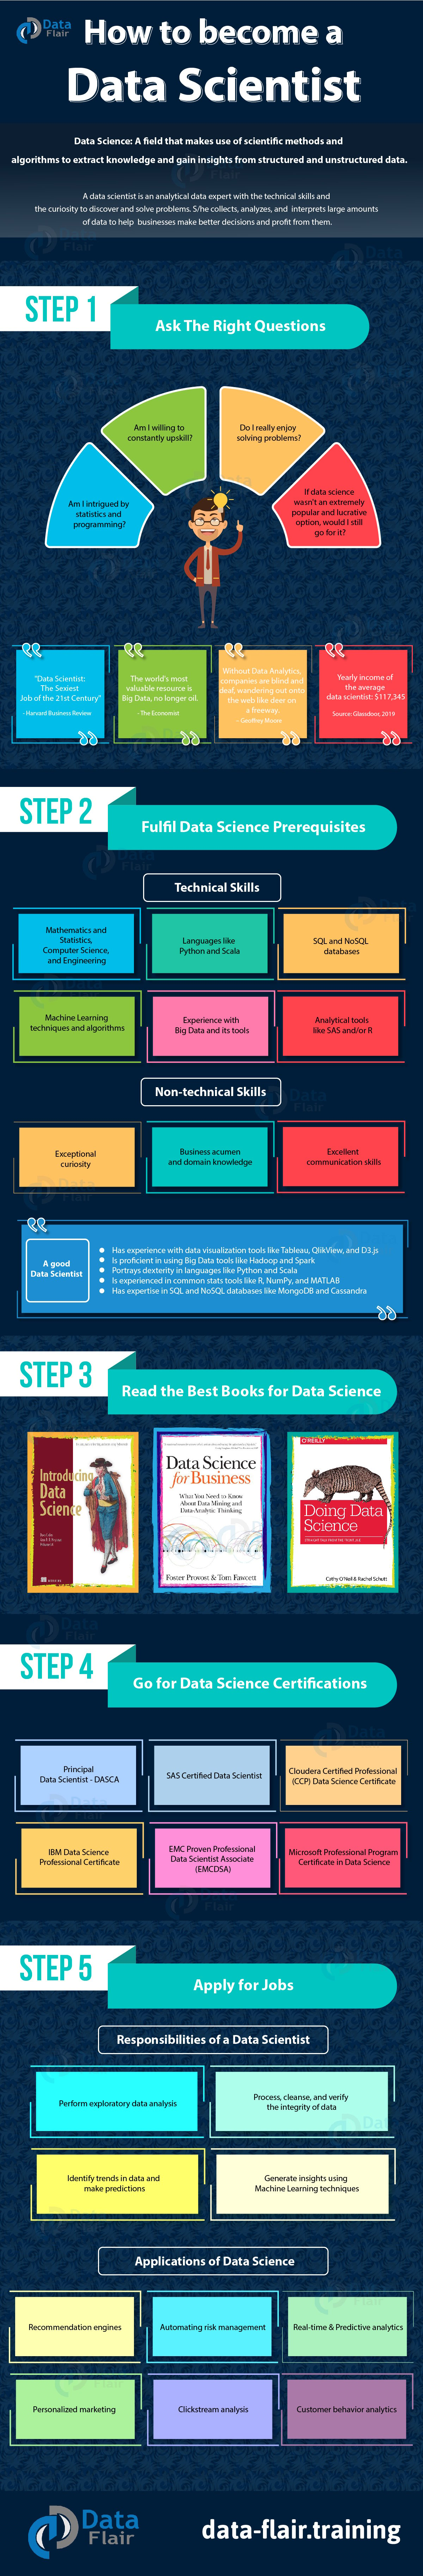
Here are some questions to ask yourself before proceeding:
- Am I intrigued by statistics and programming?
- Am I willing to constantly upskill?
- Do I really enjoy solving problems?
- If data science wasn’t an extremely popular and lucrative option, would I still go for it?
Next, you must satisfy some prerequisites before you can get used to calling yourself a data scientist. These include technical skills like maths and statistics, languages like Python and Scala, database skills, and experience with Big Data tools and Machine Learning techniques.
You will also need to hone non-technical skills like curiosity and communication skills and adopt a strong business acumen. This infographic goes on to discuss the qualities a good data scientist must possess.
Then, you should strengthen your basics by reading books on Data Science, and give yourself an edge by going for one or more industry-recognized certifications. Now, it’s time to apply for jobs to both- put to test your newly-acquired skills and get started in the career you have chosen.
Summary
To become a data scientist, one must follow a roadmap. First, learn the basics of programming, especially Python or R. Then, move to math concepts like statistics, probability, and linear algebra. After that, learn data handling tools like Pandas, NumPy, SQL, and Excel. This helps in cleaning and exploring data. The infographic should show these steps in a simple flow.
Next, learn data visualization tools like Matplotlib, Seaborn, Power BI, or Tableau. These help in creating charts and graphs. After this, study machine learning concepts like regression, classification, and clustering. You can learn these with Scikit-learn, TensorFlow, or Keras. Projects and case studies should also be included in the infographic as practice is important.
The last step is to build a portfolio and apply for jobs. Add your work on GitHub or Kaggle. Also, prepare your resume and get certifications. The infographic must include job roles like Data Analyst, Data Engineer, and Data Scientist. It should show the journey from beginner to expert in clear icons or boxes.
Your future is in your hands, and this is the time to turn it around. Follow these steps and pave yourself a path to victory; be the one to write your own story. We have a series of Data Science tutorials, you can refer them to get success in your life.
The DataFlair family wishes you all the luck in the world.
Got more tips for this “Data Scientist Infographic”? Tell us in the comments and help others like you!