


Expert-led Courses: Transform Your Career – Enroll Now
We are going to discuss about the e1071 package in R. We will understand the SVM training and testing models in R and look at the main functions of e1071 package i.e. svm(), predict(), plot(), tune() to execute SVM in R.
Let’s start the tutorial.
R – SVM Training and Testing Models
There are several packages to execute SVM in R. The first and most intuitive package is the e1071 package.
The e1071 Package:
This package was the first implementation of SVM in R.
With the svm() function, we achieve a rigid interface in the libsvm by using visualization and parameter tuning methods.
Refer some of the features of libsvm library given below:
- Offers quick and easy implementation of SVMs.
- Provides most common kernels, including linear, polynomial, RBF, and sigmoid.
- Offers computation power for decision and probability values for predictions. Also provides weighing of classes in the classification mode and cross-validation.
First, you need to set the path to include the directory where the e1071 package is. Then you have to install and include it.
You can use ‘?svm’ to see the help information of the interface.
Install e1071 package and load it using the following commands:
install.packages (‘e1071’, dependencies = TRUE)
library(e1071)
The R implementation depends on the S3 class mechanism. It provides a training function with standard and formula interfaces, and a predict() method. Also provides a plot() method for visualizing data, support vectors, and decision boundaries. We can perform hyperparameter tuning by using the tune() framework. It performs a grid search over specified parameter ranges.
Learn to create S3 and S4 class in R from the tutorial on Object Oriented Programming in R
Functions in e1071 Package
The main functions in the e1071 package are:
- svm() – Used to train SVM.
- predict() – Using this method, we obtain predictions from the model, as well as decision values from the binary classifiers.
- plot() – Visualizing data, support vectors and decision boundaries, if provided.
- tune() – Hyperparameter tuning uses tune() to perform a grid search over specified parameter ranges.
1. The svm() Function
The svm() function trains an SVM. It can perform general regression and classification, as well as density-estimation. It provides a formula interface.
The below data describes some import parameters of the svm() function:
1.1 Data – Specifies an optional data frame that contains the variables present in a model. When you use this parameter, then you don’t need to use the x and y parameters. Take the variables by default from the environment through which ‘svm’ is called from.
- X – A data matrix, a vector, or a sparse matrix (object of class matrix provided by the matrix package). It represents the instances of the dataset and their respective properties. In a data matrix, rows represent the instances whereas columns represent the properties.
Master the Working of Multiple Linear Regression in R
1.2 Type – We can use SVM as a classification machine, regression machine, or for novelty detection. It is dependent on y, that is, whether it is a factor not, the type takes C-classification or eps-regression as its default setting. It may be overwritten by setting an explicit value. Valid options are:
- C-classification
- nu-classification
- one-classification (for novelty detection)
- eps-regression
- nu-regression
- degree
1.3 parameter – It is required for the kernel of type polynomial (default: 3).
- gamma – All the kernels except the linear one require the gamma parameter.
- coef0 – Parameter needed for kernels of type polynomial and sigmoid (default: 0).
- cost – The cost of constraints violation (default: 1)—it is the ‘C’-constant of the regularization term in the Lagrange formulation.
2. The plot() Function
Use the plot() function to view the built model with a scatter plot of the input. It optionally draws a filled contour plot of the class regions. plot() function is used to represent data, support vectors and models in a visual form. Let’s learn how to use this function:
plot.svm(x, data, formula, fill = TRUE, grid = 50, slice = list(),symbolPalette = palette(), svSymbol = "x", dataSymbol = "o", ...)
Here,
- x – An object of class svm.
- Formula – Formula selecting the visualized two dimensions. Only needed, when we use more than two input variables.
- Fill – Switch indicating whether a contour plot for the class regions should be added.
- Grid – Granularity for the contour plot.
- Slice – A list of named numeric values for the dimensions are held constant. If dimensions are not specified, we can fix it at 0.
- Model – Represents an object of class svm data, resulting from the svm() function.
- Data – Represents the data to visualize. It should use the same data used for building the model in the svm() function.
- symbolPalette – Color palette used for the class the data points and support vectors belong to.
- svSymbol – Symbol used for support vectors.
- dataSymbol – Symbol used for data points (other than support vectors).
SVM allows simple graphical visualization of classification models.
Creating SVM Model in R
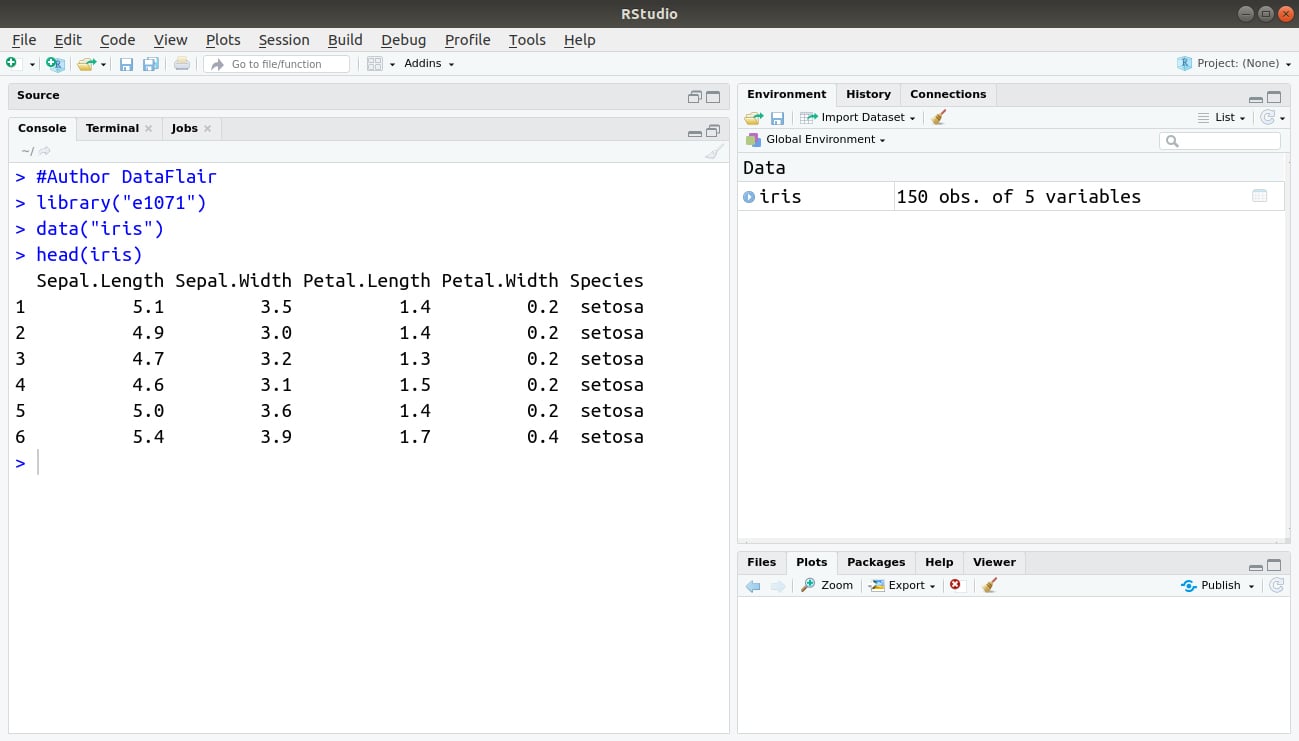
In order to create our SVM model, we will use the e1071 library and the iris dataset in R.
#Author DataFlair
library("e1071")
data("iris")
head(iris)
Output:
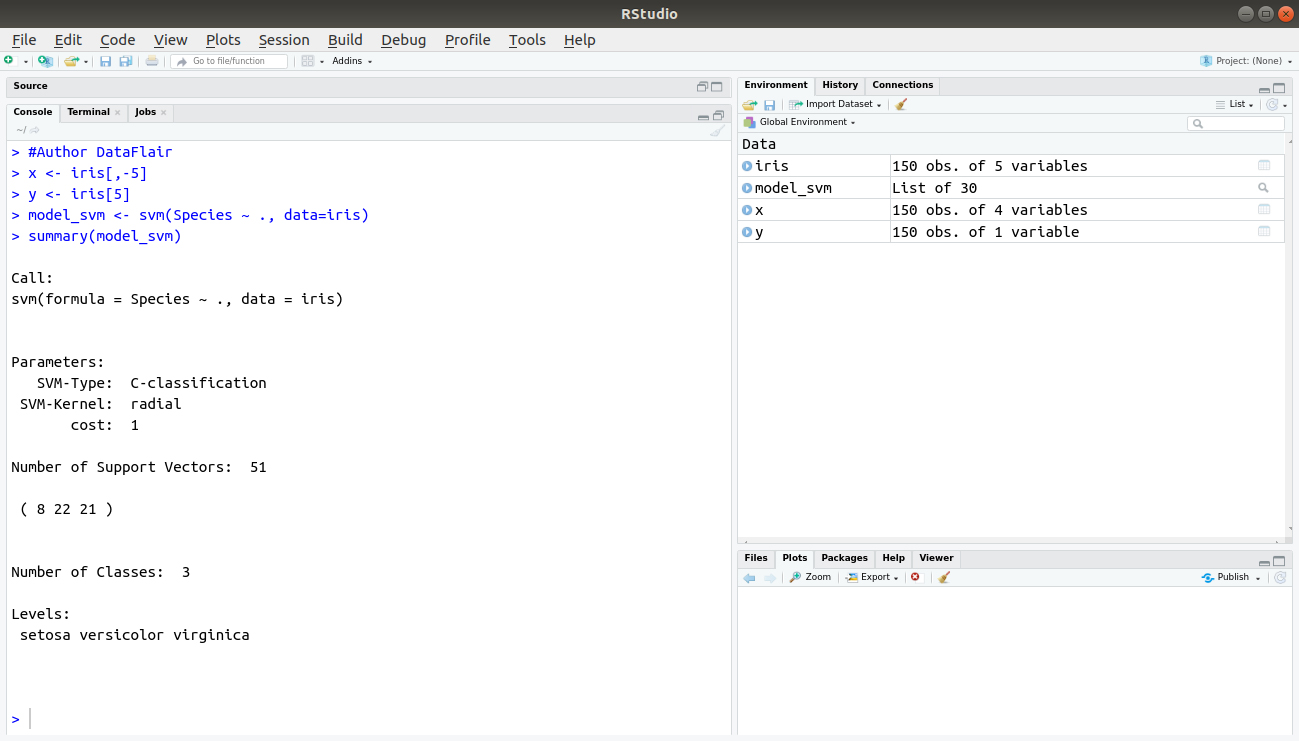
In the next step, we will partition our dataset into x and y variables. The x variables consist of all the independent variables such as Sepal.length, Sepal.Width etc. and y variable comprises of the Species, that is, setosa, versicolor and virginica.
x <- iris[,-5]
y <- iris[5]
model_svm <- svm(Species ~ ., data=iris)
summary(svm_model)
Output:
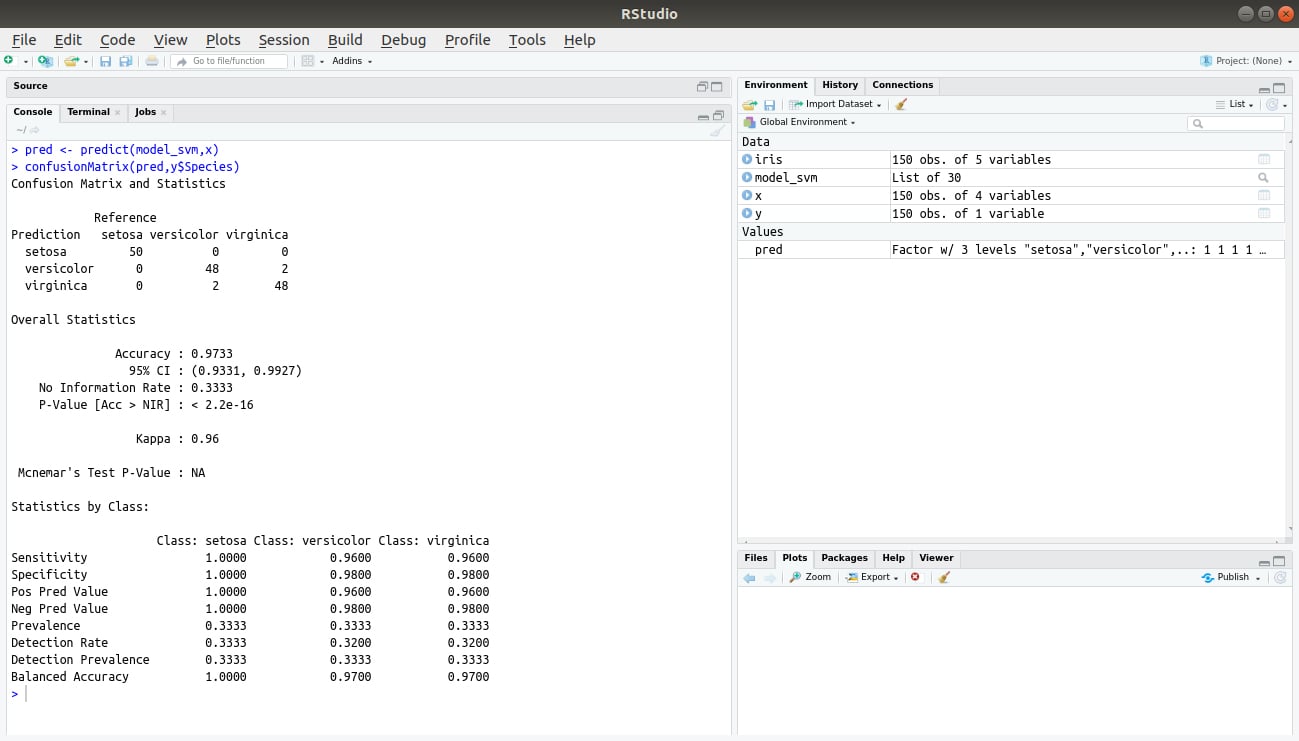
In the final step, we will perform predictions based on our input variable x. Then, we will create a confusion matrix to evaluate the result of the SVM prediction and the class data.
pred <- predict(model_svm,x)

confusionMatrix(pred,y$Species)
Output:
Summary
In this tutorial of e1071 packages in R, we discussed the training and testing models in R. We also saw the main functions of e1071 packages in R that are SVM, Plot, Predict, Tune.
Up next in our R DataFlair Tutorial Series – Bayesian Network in R
If you have any query or suggestion related to the tutorial, feel free to share with us. We will definitely solve them.