


Machine Learning courses with 110+ Real-time projects Start Now!!
Learning Matplotlib’s Subplot Functionality
An Overview
Subplots are a way to break up a larger plot into many more manageable ones. They make it simpler to analyse and understand complicated data by emphasising connections between charts. Subplots allow us to display several perspectives on our data side by side, which is useful for making comparisons and identifying patterns.
Advantages of Subplots in Matplotlib
Using subplots in data visualisation has several benefits. In the first place, they provide a visual representation of the relationships and interactions between various plots. The interdependencies and correlations in the data may be better communicated by clustering relevant panels together. Second, compact and well-organized, the plots are easier to manage thanks to subplots. This is very helpful when comparing many datasets or displaying a large number of charts at once.
Building Subplots
Utilising plt.subplots()
Matplotlib’s plt.subplots() method allows us to easily generate subplots. A figure and its associated subplots are generated by this function. A figure object representing the full figure is returned by the plt.subplots() method, together with an axes object or an array of axis objects representing the different subplots.
import matplotlib.pyplot as plott


figuree, axess = plott.subplots(nrows=2, ncols=2)
Here, we make a subplot grid with a size of 2 by 2. The subplot grid’s row and column counts may be set using the nrows and ncols parameters. The figure object is stored in the fig variable, whereas axes are an array of axis objects that stand in for the various subplots.
Rearranging Secondary Storylines
Matplotlib has a number of options for modifying the positioning and spacing of subplots. To modify the distance between subplots, we may utilise the plt.subplots_adjust() method.
plott.subplots_adjust(left=0.2, right=0.8, top=0.8, bottom=0.2, wspace=0.4, hspace=0.2)
The code snippet’s wspace and hspace arguments set the horizontal and vertical distances between subplots, while the left, right, top, and bottom parameters set the margin sizes surrounding the subplots.
Matplotlib Subplot Settings
Subplots in a single column or row
In certain cases, it might be helpful to line up related stories vertically. Matplotlib facilitates the creation of such setups with relative ease.
figuree, axess = plott.subplots(nrows=1, ncols=2)
In this case, we’ll make three individual plots in a row. Matplotlib is instructed to produce a single row with three subplots with the parameters nrows=1 and ncols=2.
Subplot Grid
Subplots on a grid may be more convenient in other contexts. With Matplotlib, we can create a subplot grid with as many rows and columns as we want.
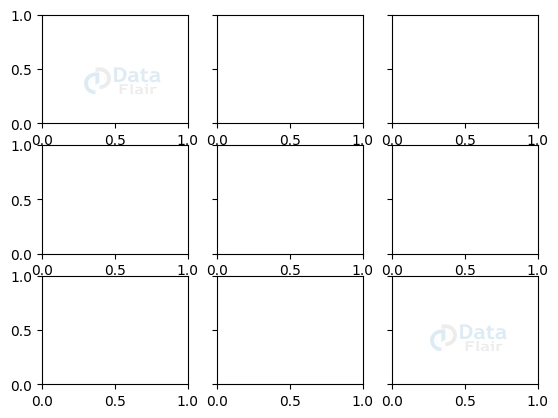
figuree, axess = plott.subplots(nrows=4, ncols=3)
Here, we make a 4×3 grid of subplots. Modify the grid’s layout by changing the values of nrows and ncols.
Subplot Arrangements That Don’t Add Up
In more intricate situations, it may be necessary to include many plots inside a single graph, each with its own scale and proportions.
figuree, axess = plott.subplots(nrows=3, ncols=2, gridspec_kw={'width_ratios': [1, 2], 'height_ratios': [2, 1]})
The relative sizes of the subplots are defined in this code snippet by defining the width_ratios and height_ratios inside the gridspec_kw argument. Subplots of varying widths and heights will be produced as a consequence.
We may create unique layouts that meet the requirements of our data visualisation by experimenting with various subplot arrangements.
Graphing on Subplots in Matplotlib
Subplot Data Plotting
Next, we’ll plot our data on several subplots that we’ve prepared in Matplotlib. As a result, we may compare and contrast the visual representations of various datasets or variables.
Making separate plots for each subplot
The plt.subplots() method returns axis objects that may be used to plot data on separate subplots. To construct the necessary plots, we simply call plotting functions on the axis objects that represent each subplot.
import matplotlib.pyplot as plott


a1 = [1, 2, 3, 4]
b1 = [7, 3, 6, 4]
a2 = [1, 8, 3, 4]
b2 = [2, 5, 4, 3]
a3 = [1, 2, 3, 4]
b3 = [7, 6, 5, 3]
a4 = [1, 3, 2, 4]
b4 = [6, 2, 9, 5]


figuree, axess = plt.subplots(nrows=2, ncols=2)


dataset = [(a1, b1, 'purple', 's'), (a2, b2, 'red', 'o'), (a3, b3, 'orange', None), (a4, b4, 'blue', '.')]


for axess, (x, y, color, marker) in zip(axess.flatten(), dataset):
   axess.plot(x, y, color=color, marker=marker)


plt.show()
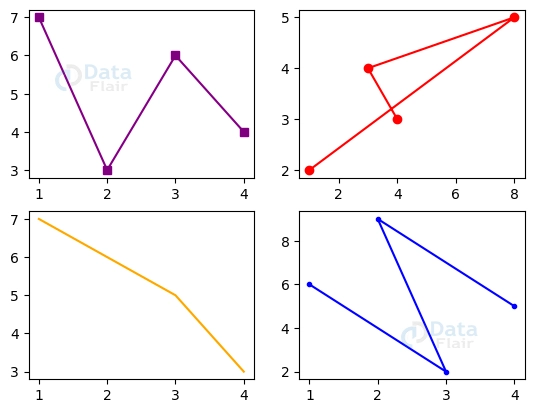
In this case, we’ll create a grid of subplots (2×2) and plot individual data sets on each of them. To alter the visual look of the plots, we may provide the preferred plot characteristics such as colours, markers, and linestyles.
Modifying Land Characteristics
Subplots allow for even more detailed customization through a wide range of plot variables. To draw attention to certain details in our data, we may, for instance, alter the background colour, markers, linestyles, and linewidths. Plots may have their readability and visual impact improved by using axis limitations, gridlines, and other formatting choices.
Limit and Axis Sharing
Sharing the x or y axis across numerous subplots is a common practise when dealing with subplots. The plotted data may thus be more easily compared and aligned. Matplotlib has tools that make it easy to share axes and manage their bounds and scales.
Subplots that share an axis (either the x or y axis)
When creating subplots, the sharex and sharey parameters may be used to allow them to share the same axes.
figuree, axess = plott.subplots(nrows=3, ncols=3, sharey=True)
In this case, all of the subplots will share the same x-axis and coordinate system if the sharey=True option is used.
Modifying the range and size of axes that are parallel
We may adjust the range and scale of common axes to zero on a subset of the data or highlight a particular feature. Consistency and freedom from misunderstanding amongst plotlines may be achieved by the use of clearly stated bounds and scales.
import matplotlib.pyplot as plott


figuree, axess = plott.subplots(nrows=2, ncols=2)


axess[0, 0].set_xlim(0, 10)
axess[1, 0].set_ylim(0, 100)


plott.show()
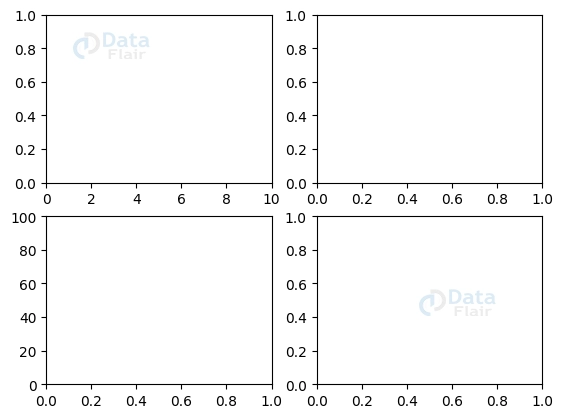
In this code snippet, we restrict the first and second subplots to separate x and y ranges.
Identifying elements with Titles
Titles and labels are essential for providing necessary context and improving the readability of our subplots. Labels explain the axes and data being plotted, whereas titles reflect the subplot’s general content or purpose.
Identifying and titling each subplot
By using the proper methods on the axis objects, we can give each subplot its own title and label.
import matplotlib.pyplot as plott


figuree, axess = plott.subplots(nrows=2, ncols=2)


axess[0, 0].set_title("First Subplot DataFlair")
axess[0, 1].set_xlabel("X Label")
axess[0, 1].set_ylabel("Y Label")


plott.show()

Here, we’ll give the first subplot a title and identify its axes while also doing the same for the second.
Subtitle and label text properties can be modified
Subplot titles and labels may be styled whatever we want by adjusting their text characteristics such font size, colour, style, and alignment.
import matplotlib.pyplot as plt


fig, axes = plt.subplots(nrows=2, ncols=2)


axes[0, 0].set_title("First Subplot DataFlair", fontsize=10, color='red', fontstyle='italic')
axes[0, 1].set_xlabel("X Label", fontsize=10, color='orange', ha='right')
axes[0, 1].set_ylabel("Y Label", fontsize=10, color='purple', va='top')


plt.show()
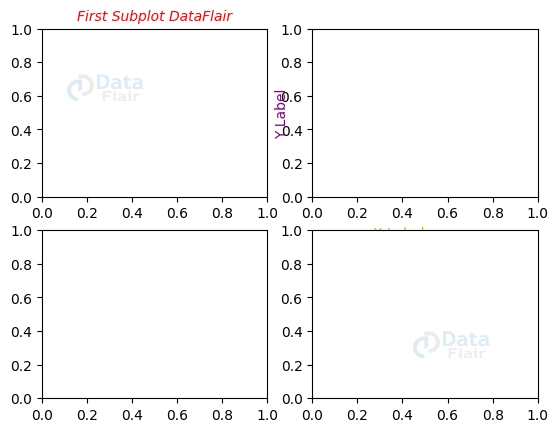
In this code snippet, we change the size, colour, and style of the font used for the title and labels of the first and second subplots, respectively.
Subplot Space and Padding in Matplotlib
Managing Subplot Spacing
It is possible to modify the distance between subplots to get a more visually appealing layout. The horizontal and vertical spacing may both be adjusted using Matplotlib’s available settings.
1. Regulating the amount of time spent on secondary stories: The subplots_adjust() method enables us to set the vertical and horizontal distances between subplots.
2. Adjusting padding around subplots: Padding around subplots may be adjusted as well so that every inch of the figure is put to good use. To modify the margins on all sides, use the subplots_adjust() function’s optional top, bottom, left, and right arguments.
Subplot Axis Alignment
Aligning plot components across subplots is essential for creating a unified visual presentation of several storylines.
Alignment of subplot axes for uniformity: Subplot axes may be aligned with the help of the align_labels() method, included in the matplotlib.pyplot package. By using this feature, you may easily align the subplot axis labels to the left, right, top, bottom, left, or right.
Conclusion
Matplotlib’s subplots are a useful tool for organising several plots inside a single figure, which greatly simplifies the process of comparing and analysing data from many sources. Learn how to construct useful and aesthetically pleasing visualisations by plotting data on subplots, sharing axes, including titles and labels, and adjusting the spacing and alignment.
Matplotlib gives us a wide variety of choices and tools for experimenting with and personalising subplots. We encourage further exploration and innovation in data visualisation as we learn more about the potential of subplots to reveal hidden insights and improve the clarity of data transmission.