


We offer you a brighter future with industry-ready online courses - Start Now!!
In this tutorial, we are going to learn about the system monitor available in the SAP HANA Administration Console. We will learn about the process to use system monitor and tabs present in it. Let us start with the tutorial without any ado.
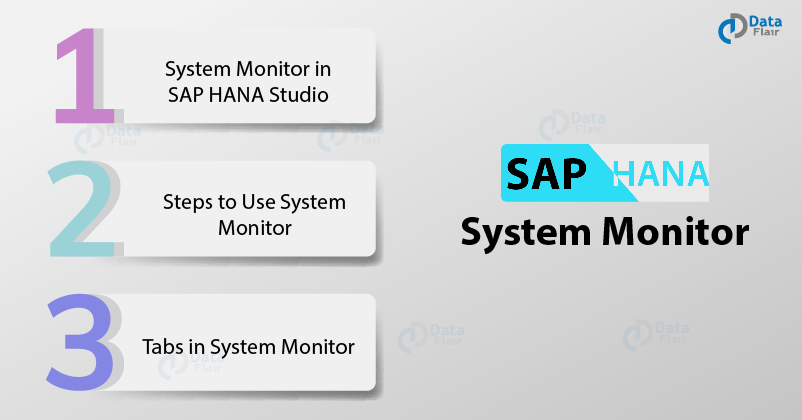
System Monitor in SAP HANA Studio
In the SAP HANA Studio, you can monitor the system’s health and availability of the components through the System Monitor. It is used to monitor the SAP HANA system and administer the components.
Also, using the system monitor, you can access the system’s details and configurations and the services offered by different SAP HANA components.
Several aspects that can be monitored through the SAP HANA system monitor are the alerts, disk space, log disks, trace disk, data disk, memory, performance, volume, etc. Thus, it is convenient to manage individual aspects, tasks, and components.
How to Use the System Monitor?
Below are the steps to start using the system monitor in the SAP HANA studio:
Step 1: Open the SAP HANA Studio with the data systems loaded in it. Make sure you are working in SAP HANA Modeler perspective.
Step 2: If you haven’t logged into the system, perform the login first.
To log into a system in order to access the system monitor, right-click on the system’s name. Click on Log On.
Database User Logon
Step 3: Enter the User Name and Password. Click on OK.
Once you get access to the system, click on the System Monitor icon given at the top of the system pane.
Step 4: This opens the system monitor dashboard with all the information about the system divided into different tabs. The main tabs present on the System Monitor console is System ID, Operational State, Alerts, Data Disk (GB), Log Disk (GB), Trace Disk (GB) and CPU(%).
Step 5: Click on your system name under the System ID to drill further down into the system’s detail.
This opens numerous tabs having information on different aspects of the system.
1. The first tab is the Overview tab which contains information and details on general aspects such as general information, alerts, and messages priorities, SAP HANA used memory, disk usage, resident memory, etc. The overview tab is divided into five sections; General Information, SAP HANA Used Memory, Resident Memory, Current Alerts and Messages, and Disk Usage.
- The General Information section displays system information such as Operational status, System usage, Start time of first started service, Start time of most recently started service, Distributed system, Version, Build time, Platform, Linux Kernel version, and Hardware manufacturer.
- SAP HANA Used Memory has information as, On Host best (used memory/peak used memory/allocation limit in GBs).
- The Resident Memory section shows the On Host best (used memory/peak used memory/allocation limit in GBs) memory use.
- The Current Alerts and Messages section displays the number of alerts of HIGH and LOW priority.
- The Disk Usage section shows Data Volume Size/Total Disk Usage/Total Disk Size(GB), Log Volume Size/Total Disk Usage/Total Disk Size(GB), and Trace Volume Size/Total Disk Usage/Total Disk Size(GB).
2. Another tab is the Alerts tab where you can find all the information and details on the alerts set in the selected system. It also shows the Time of alert, Description of the alert, Priority status for each alert and Host name.
3. From the Performance tab, you can access the details on the services going on in and on the selected database. There are several sub-tabs within the Performance tab such as Threads, Sessions, Blocked Transactions, SQL Plan Cache, Expensive Statements Trace, Job Progress and Load.
Step 6: Also, you can right-click on the system’s name in the system’s pane and access the administration dashboard or cockpit to find more details on the system’s health, component configurations, and alerts.
To do this, right-click on your SAP HANA system name > click on Configuration and Monitoring > select Open Administration/Open SAP HANA Cockpit.
Tabs in System Monitor
System monitor divides the system’s information into many tabs. Each tab is dedicated to providing information on a specific aspect of the system.
- System ID (An ID assigned to a specific system)
- Operational Status (Shows the overall system status)
- Alerts (Shows the details on alerts and their status. Alerts are set primarily for two reasons, one for resource usage and statistical thresholds violations. Second is the information alerts. You can set the alert priority as low, medium and high)
- Data Disk (Shows the data volume size on disk)
- Log Disk (Shows the size of log volume on disk)
- Trace Disk (Shows the size of trace files on disk)
- Database Resident Memory (Shows the available space on resident memory in the OS assigned to SAP HANA)
- System Resident Memory (Total size of the resident memory in the OS)
- Used Memory (Amount of system’s memory used by SAP HANA Database)
- CPU (%) (Shows the percentage of CPU used by SAP HANA system)
- Hostname (Name of the server that hosts SAP HANA Database)
- Instance Name (It shows the number of administrative units which comprises of the server and other components)
- Start TimeFirst (Shows the time when the first service is started)
- Start TimeLatest (Shows the time when the last service was started)
- Version (Shows the software version series or number of the SAP HANA Studio)
- Platform (Shows the information of the OS on which the SAP HANA Studio is running)
Summary
We hope this tutorial will help you in using the System Monitor in the SAP HANA Studio to administer and monitor the databases in SAP HANA. In case of any suggestions or queries, drop your comments below. We will be happy to help!