


Master Python with 70+ Hands-on Projects and Get Job-ready - Learn Python
In this Python Tools tutorial, we will focus on Python Dis modules, Python PDB module, Python Profile module, and Python Tabnanny module with examples.
So, let’s start with Python Tools.
Which Python Tools are Commonly Used?
Here, we will discuss 4 types of Python Utilities.
1. Python Dis Module
To convert bytecode into a more human-readable format, Python has the ‘dis’ module. You can say that it compiles a script, disassembles the bytecode, and prints the output to STDOUT. Moreover, you can use it as a module or through the command line.
Use of Dis Module in Python:
- Performance optimization: Different code versions can be compared to see which one uses fewer or more steps.
- Debugging: By seeing the exact order of the operation, you can find out the hidden errors.
- Understanding internals: It helps in understanding how features like loops and decorators are applied at lower levels.
As an argument, we can pass a function, a method, a class, or a code object to the dis() function.
For Example
>>> def add():
     a=3
     b=4
     c=a+b
     print(f"{a}+{b}={c}")
>>> add()
3+4=7
Now, we import the Python dis module and call the dis() function on it.
>>> dis.dis(add)
2 0 LOAD_CONST 1 (3)
2 STORE_FAST 0 (a)
3 4 LOAD_CONST 2 (4)
6 STORE_FAST 1 (b)
4 8 LOAD_FAST 0 (a)
10 LOAD_FAST 1 (b)
12 BINARY_ADD
14 STORE_FAST 2 (c)
5 16 LOAD_GLOBAL 0 (print)
18 LOAD_FAST 0 (a)
20 FORMAT_VALUE 0
22 LOAD_CONST 3 (‘+’)
24 LOAD_FAST 1 (b)
26 FORMAT_VALUE 0
28 LOAD_CONST 4 (‘=’)
30 LOAD_FAST 2 (c)
32 FORMAT_VALUE 0
34 BUILD_STRING 5
36 CALL_FUNCTION 1
38 POP_TOP
40 LOAD_CONST 0 (None)
42 RETURN_VALUE
2. Python Tabnanny Module
Python tabnanny checks code for ambiguous indentation.
Hence, it tells us about any weird combinations of tabs and spaces in the code. In Python, whitespace shouldn’t be ambiguous.
Like dis, we can run tabnanny from the command line or using the function check().
>>> import os
>>> import tabnanny
>>> os.chdir('C:\\Users\\lifei\\Desktop')
>>> tabnanny.check('nannydemo.py')
>>>
Python Tabnanny module has the following methods:
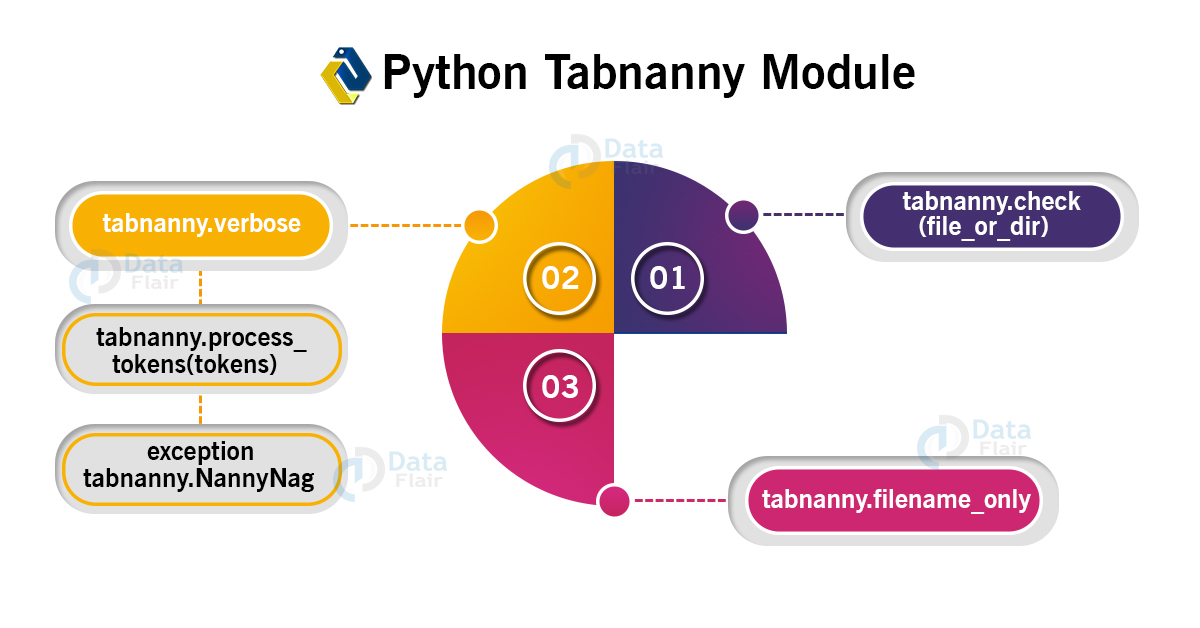
a. tabnanny.check(file_or_dir) in Python
This checks the file or directory we pass to it for examining whitespace-related issues. Then, it prints the diagnostic messages to the standard output.
b. tabnanny.verbose in Python
This is a flag that depicts whether Python will print verbose messages.
c. tabnanny.filename_only in Python
This is a flag that depicts whether Python should print only the filenames for those files that contain issues involving whitespace. It also has the following function:
i. tabnanny.process_tokens(tokens)
The tokenize module generates some tokens. check() uses process_tokens() to process these tokens.
Finally, this module may raise the following exception:
ii. exception tabnanny.NannyNag
When process_tokens() detects an ambiguous indent, it raises this exception. check() captures and handles this.
3. Python Profile Module
We may sometimes like to know which parts of our code take the longest. So in a way, through profiling, we try to find bottlenecks in our code. Other profilers in Python are cProfile and hotshot.
Let’s try this module with the cProfile module.
>>> import hashlib
>>> import cProfile
>>> cProfile.run("hashlib.md5('abcdefghijkl').digest()")
4 function calls in 0.000 seconds
Ordered by: standard name
ncalls tottime percall cumtime percall filename:lineno(function)
1 0.000 0.000 0.000 0.000 <string>:1(<module>)
1 0.000 0.000 0.000 0.000 {built-in method _hashlib.openssl_md5}
1 0.000 0.000 0.000 0.000 {built-in method builtins.exec}
1 0.000 0.000 0.000 0.000 {method ‘disable’ of ‘_lsprof.Profiler’ objects}
Furthermore, we profile the creation of an MD5 hash here. The first output we get tells us that four function calls were made. Although these are ordered by standard name.
Here’s what all the other columns mean:
- ncalls: The number of calls made.
- tottime: Total time spent in a function.
- percall: The quotient of tottime divided by ncalls.
- cumtime: Cumulative time spent in this function and all subfunctions.
- percall: The quotient of cumtime divided by primitive calls.
- filename: lineno(function)- Data of each function.
4. Python PDB Module
Pdb is the standard Python debugger. It helps us debug our code line by line.
Use of PDB Module in Python:
- Sets breakpoints: When the program is running, and you pause it, it allows you to check the variables at that point.
- Stepping through code: You can move the code one step forward to check if something is wrong in the code.
- Code listing: It is a window where you can see which line of the code is running.
>>> import pdb
>>> n=4
>>> def raised(a):
      return a**a
pdb.set_trace()
eight=raised(8)
>>> print(eight)
>>> two=raised(2)
>>> print(two)
In the command prompt:
C:\Users\lifei\Desktop>python nannydemo.py
> c:\users\lifei\desktop\pdbdemo.py(6)<module>()
-> seven=raised(7)
(Pdb)
Now, we can use the commands of the pdb module to debug our code.
Important Interview Questions on Python Tools
1. What are the various Python Tools and why are they used?
2. Explain the Python PDB Module.
3. What are Profilers in Python, and name some Python Profilers.
4. Name some methods in the Tabnanny Module.
5. What is the use of the Dis Module in Python?
Conclusion
At Last, these are a few basic tools and utilities of Python: Dis modules, PDB module, the Profile module, and Tabnanny module with an example.
Furthermore, if you have any further queries, feel free to ask in the comments section.