


Master Python with 70+ Hands-on Projects and Get Job-ready - Learn Python
In our previous tutorial, we talked about Python Django. Today, in this Data Wrangling tutorial, we will see Python Aggregation and Data Wrangling with the Python Programming Language. Moreover, we will discuss prerequisites & reasons to use Data Wrangling with Python. In addition, we discuss Dropping Missing Values, Grouping Data, Filtering Data, Pivoting Dataset, Shifted Datasets, Melted Data, Reducing into an ABT, Concatenating Data, Exporting Data, and Python Aggregate.
So, let’s start Aggregation and Data Wrangling with Python.
Brief on DataFrames
A DataFrame in pandas is a 2-dimensional data structure that holds data in a tabular sense. This means it lets us work in a context of rows and columns.
A dataframe is:
- Mutable.
- Capable of holding columns of different types.
- Capable of performing arithmetic operations on rows and columns.
- A holder of labeled axes for the rows and columns.
Disadvantages of dataframes:
- If a large file is stored in the computer’s RAM, there are chances that your system might crash.
- As only one part of the CPU is used, it can slow down while managing multiple rows.
- As there are many commands, it becomes difficult to remember them.
- Since libraries like Pandas are big, if they are installed in a small app, it can make it work slower.
This is the DataFrame constructor we have-
pandas.DataFrame (data, index, columns, dtype, copy)
Read about Python Data File Formats – How to Read CSV, JSON, and XLS Files
Python Data Wrangling – Prerequisites
a. Python pandas
For aggregation and Data wrangling with Python, you will need the pandas library. It helps us with data manipulation and analysis. It has data structures and allows operations that we can use to manipulate numerical tables and time series.

Aggregation and Data Wrangling with Python
You can install it using the following command-
C:\Users\lifei>pip install pandas
At the time of writing, we use version 0.23.1 of pandas.
b. Python NumPy
NumPy is another Python library that lets us handle large, multi-dimensional arrays and matrices. It also offers various high-level mathematical functions to help us deal with these.

Aggregation and Data Wrangling with Python
To install this, you can try the following command in the command prompt-
C:\Users\lifei>pip install numpy
How to Work with NoSQL Database in Python using PyMongo
c. Python DataFrames
For our purpose, we will need two dataframes. We can create a DataFrame using any data type, like a list, a dictionary, or a series. We can also use NumPy and an array or another DataFrame to create it. Let’s use a dictionary for now.
>>> one=pandas.DataFrame({
	'emp_id':[1,2,3,4,5],
	'dept_name':['duvet','bidet','footwear','clothing','electronics'],
	'aisle':[1,2,3,4,5]})
>>> first=pandas.DataFrame(one)
>>> two=pandas.DataFrame({
	'emp_id':[6,7,8,9,10],
	'dept_name':['grocery','toys','laundry','frozen','stationery'],
	'aisle':[6,2,2,9,10]})
>>> second=pandas.DataFrame(two)
We also create a CSV file with UTF-8 format in Excel-

Aggregation and Data Wrangling with Python
We save this as supermarket.csv.
Why We Need Data Wrangling with Python
Much data obtained from various sources is raw and unusable. This could be messy or incomplete. With data wrangling with Python, we can perform operations on raw data to clean it in an organized format. Wrangling is essential to data science as a clean dataset leads to a more reliable model. Let’s take a quick look at it.
Dropping Missing Values
As you can see, we have no aisle number for the frozen department in our csv file.
>>> import os
>>> os.chdir('C:\\Users\\lifei\\Desktop')
>>> three=pandas.read_csv('supermarket.csv')
>>> pandas.isnull(three).any()
emp_id        False
dept_name     False
aisle         True
dtype:        bool
This shows us that the ‘aisle’ column does have a missing value. The following command shows us the null values in the file-
>>> three.head()
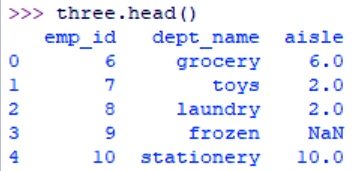
Aggregation and Data Wrangling with Python
Let’s Revise Python File I/O – Python Write to File and Read File
To drop this record, we use the following command-
>>> three.dropna()

Data Wrangling with Python – Dropping Missing Values
Grouping Data
The pandas gorupby() method returns a DataFrameGroupBy object. Calling the method value_counts() returns the number of occurrences for each unique value in the column we specify.
>>> three.groupby('aisle').dept_name.value_counts()

Data Wrangling with Python – Grouping Data
This tells us about the correlation between aisle number and department name. This lets us discover trends in data. In situations where we want to see trends by the city, we can group records by their geographical factors.
a. Finding unique values
For this, we can use the unique() method.
>>> two.aisle.unique()
array([ 6, 2, 9, 10], dtype=int64)
b. Length of dataframe
Then the len() function gives us the length of the dataframe.
>>> len(two)
5
Do you know how I Used These 5 Steps to learn Python for Data Science
Filtering Data
To gain a subset of data using some criterion, we can filter out parts we don’t need.
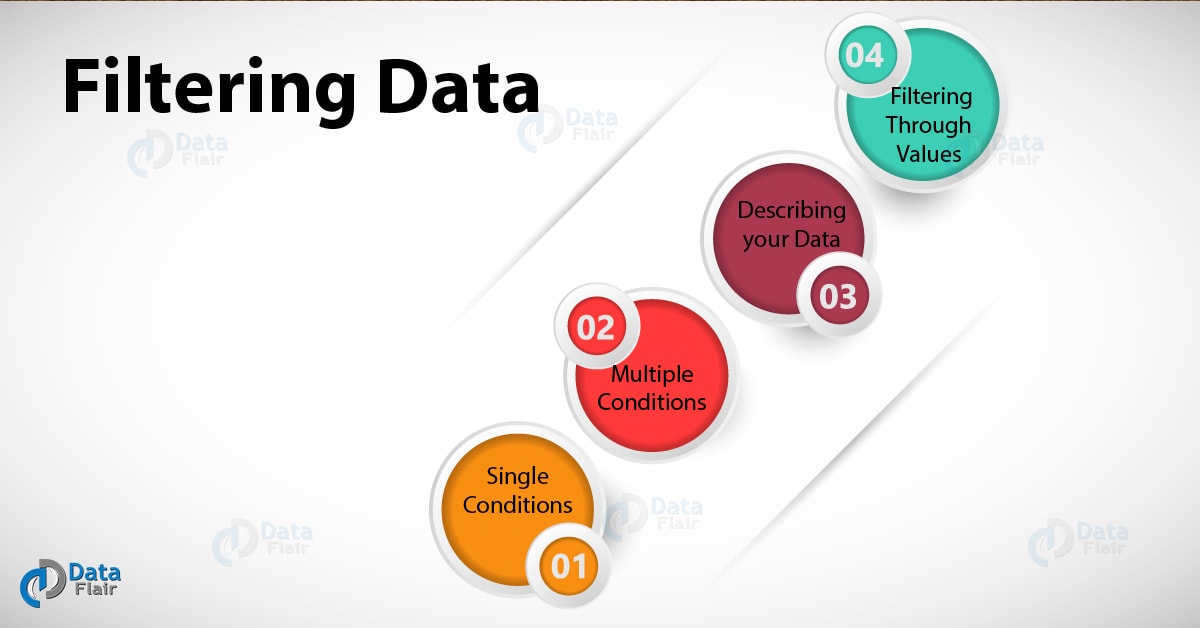
Data Wrangling with Python – Filtering Data
a. Single Conditions
>>> two[two['aisle']>3]
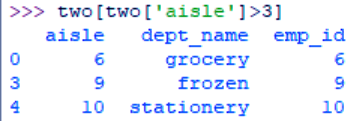
Filtering Data – Single Conditions
>>> two[two['aisle']==2]
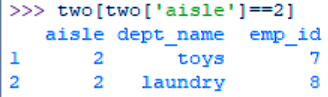
Filtering Data – Single Conditions
b. Multiple Conditions
>>> two[(two['aisle']==2) & (two['dept_name']=='toys')]
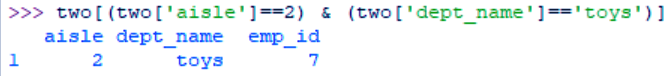
Filtering Data – Multiple Conditions
Let’s Read about Python Counter – Python Collections Type
c. Describing your Data
>>> (two[(two['aisle']==2) & (two['dept_name']=='toys')]).describe()
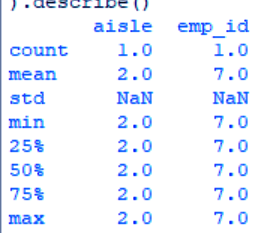
Filtering Data – Describing your Data
d. Filtering through Values
>>> two[two.aisle.isin([2,7,9])]
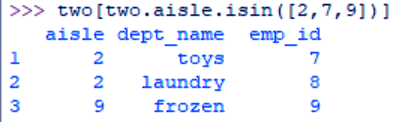
Filtering through Values
Pivoting Dataset
Pivoting lets us reshape a DataFrame by column/index values. In other words, it produces a pivot table.
>>> (two.pivot(index='emp_id',columns='aisle',values='dept_name')).tail()
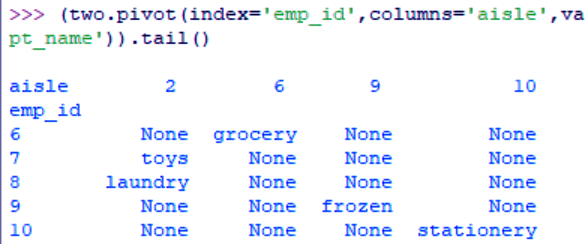
Data Wrangling with Python – Pivoting a Dataset
Providing a number to this tail() call will give us that many records.
>>> (two.pivot(index='emp_id',columns='aisle',values='dept_name')).tail(3)
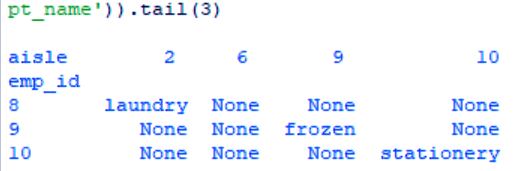
Data Wrangling with Python – Pivoting a Dataset
a. Shifting a pivoted dataset
We can shift the DataFrame’s index by a certain number of periods using the shift() method.
>>> (two.pivot(index='emp_id',columns='aisle',values='dept_name')).tail(3).shift(1)

Data Wrangling with Python – Shifting a pivoted dataset
Let’s Discuss Python Operator Overloading and Python Magic Methods
Melting Shifted Datasets
We can also melt a dataset (unpivot it).
>>> (two.melt(id_vars=['emp_id'],value_name='dept_name')).tail()
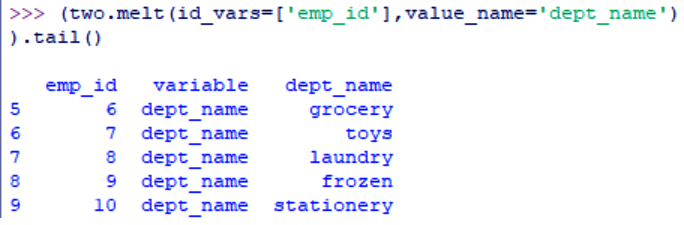
Data Wrangling with Python – Melting Shifted Datasets
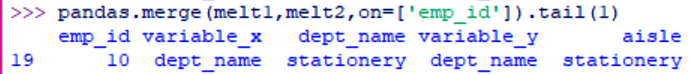
Merging Melted Data
We can join melted DataFrames into one Analytical Base Table using the merge() function.
>>> melt1=two.melt(id_vars=['emp_id'],value_name='dept_name')
>>> melt2=two.melt(id_vars=['emp_id'],value_name='aisle')
>>> pandas.merge(melt1,melt2,on=['emp_id']).tail(1)
Aggregation and Data Wrangling with Python
Reducing to an ABT
Finally, to reduce this result into an analytical base table, we do the following:
>>> from functools import reduce
>>> base=two[['aisle','dept_name','emp_id']]
>>> feature=[base]+[melt1,melt2]
>>> abt=reduce(lambda left,right: pandas.merge(left,right,on=['emp_id']),[melt1,melt2])
>>> abt.tail(1)
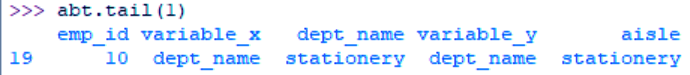
Data Wrangling with Python – Reducing into an ABT
Concatenating Data
We can concatenate datasets along an axis using the concat() method.
>>> pandas.concat([one,two])
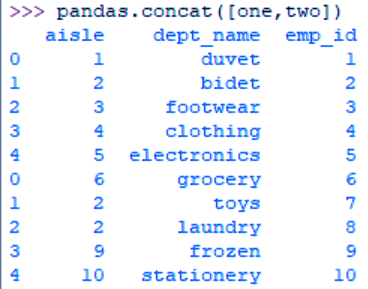
Concatenating Data
Have a look – Lessons on Python Sequences and Collections
Exporting Data
Finally, we can export our clean and filtered data to an Excel sheet.
>>> res=pandas.concat([one,two])
>>> res.to_excel('res.xlsx')
How does Python Aggregate Data?
To apply aggregations on our datasets, we can use the Python numpy library along with pandas. It allows for summarizing data based on categories.
Learn Aggregation and Data Wrangling with Python
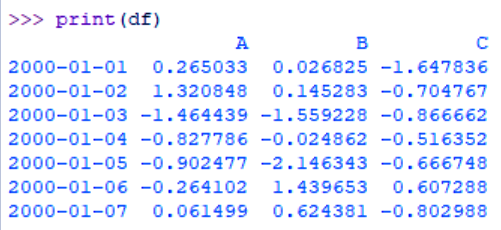
Let’s create a dataframe first.
>>> df=pandas.DataFrame(numpy.random.randn(7,3),
	index=pandas.date_range('1/1/2000',periods=7),
	columns=['A','B','C'])
>>> print(df)
How Python Aggregate Data
>>> print(df.rolling(window=3,min_periods=1))
Rolling [window=3,min_periods=1,center=False,axis=0]
Let’s explore The Best Article on Python’s Various Libraries
a. Python Aggregating an entire dataframe
We can aggregate an entire dataframe as-
>>> r=df.rolling(window=3,min_periods=1)
>>> r.aggregate(numpy.sum)
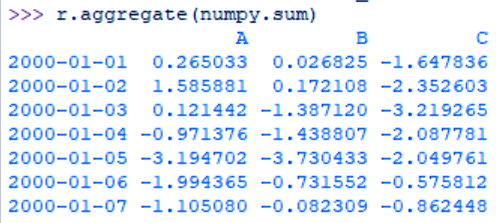
How Python Aggregates Data
As you can see, this keeps aggregating the previous value into itself. Another aggregation we can use is max-
>>> r.aggregate(numpy.max)
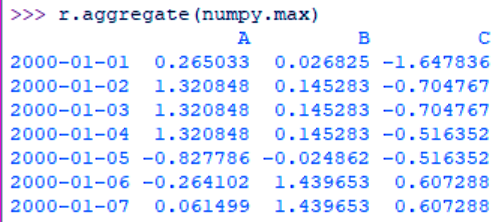
Python Aggregating an entire dataframe
Other aggregations include mean, median, and min.
b. Python Aggregating one column
To aggregate just one column, we can use its index.
>>> r['B'].aggregate(numpy.mean)
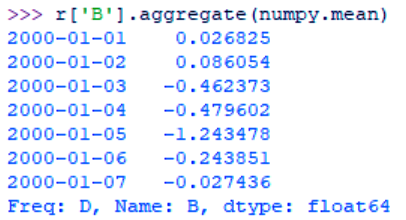
Python Aggregating one column
Let’s See the Python Property – The Problem and Solution
c. Python Aggregating multiple columns
We can also specify more than one column to aggregate.
>>> r[['B','C']].aggregate(numpy.sum)

Python Aggregating multiple columns
So, this was all about Aggregation and Data Wrangling with Python. Hope you like our explanation.
Conclusion
Hence, this was how to clean your data with wrangling and then how to apply aggregations on it. Did we miss out on something in Aggregation and Data Wrangling with Python? Drop your suggestions in the comments.
See Also- List of 63 Python os Modules
For reference