Why Choose R for Data Science – Discover Top Features and Companies
Free Machine Learning courses with 130+ real-time projects Start Now!!
We all know that the exponential increase in data has led to the rise in demand for specialized data scientists. This calls for advanced data analytics tools that can help is developing insights from the data. R is an important tool for Data Science.
It is highly popular and is the first choice of many statisticians and data scientists alike. But what makes R so popular? Why and How to use R for Data Science?
With this article, we will try to solve your queries and show you the features of R, which makes R highly suitable language for Data Science.
1. What is R?
R programming language is one that allows statistical computing that is used widely by the data miners and statisticians for data analysis. It was developed in 1995 by Ross Ihaka and Robert Gentleman, where the name ‘R’ was derived from the first letters of their names.
R is a popular choice in data analytics and data science for statistical computing and graphical techniques.
R contains a collection of over 10,000 packages in its CRAN repository. These packages appeal to various statistical applications. For beginners, R may offer a steep learning curve. But while the syntax of R may be easy to understand.
It is an expressive tool that is used to implement statistical learning. Therefore, a user without knowledge of statistics may not be able to get the best out of R.
2. Why We Choose R for Data Science?
Data Science has emerged as the most popular field of the 21st century. It is because there is a pressing need to analyze and construct insights from the data. Industries transform raw data into furnished data products.
In order to do so, it requires several important tools to churn the raw data. R is one of the programming languages that provide an intensive environment for you to analyze, process, transform and visualize information.
It is the primary choice for many statisticians who want to involve themselves in designing statistical models for solving complex problems.
R contains a sea of packages that appeal to all the forms of disciplines like astronomy, biology, etc. While R was originally used for academic purposes, it is now being used in industries as well.
R is an advanced language that is used for performing complex statistical modeling. Moreover, R also provides support for operations on arrays, matrices, and vectors. R is famous for its graphical libraries that allow the users to delineate aesthetic graphs and make them intractable for the users.
Moreover, R allows its users to develop web-applications using R Shiny, which is used for embedding visualizations in web-pages and provides a high level of interaction to the users.
Furthermore, data extraction is an important part of data science. In order to do so, R provides the option of interfacing your R code with database management systems.
In addition to this, R provides you with several options of advanced data analytics like the development of prediction models, machine learning algorithms, etc. R also provides several packages for image processing
3. Features of R
There are important features of R, which we should discuss to understand the role of R for Data Science.
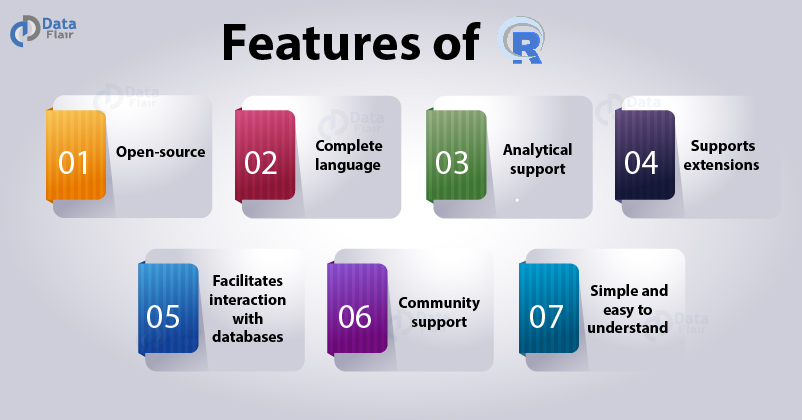
- Open-source – R is an open-source tool which means that you can download and modify the code and even develop your own libraries. It is also free to use.
- A complete language – While R is generally perceived to be a programming language for statistics, it also contains several features of an Object Oriented Programming language.
- Analytical support – With R, you can perform analytical operations through its wide range of support libraries. You can clean, organize, analyze, visualize your data and can also create predictive models.
- Supports extensions – R allows the developers to write their own libraries and packages and facilitate these packages as distributed add-ons. This makes R a developer-friendly language that allows changes and updates in its tools.
- Facilitates interaction with databases – It consists of several add-on packages that connect R with databases like RODBC package, Open DataBase Connectivity Protocol (ODBC) and the ROracle package that allows interaction with Oracle databases. The R programming language also provides extensions of MySQL as RMySQL.
- Extensive community support – It has an active community which is further bolstered by the fact that R is an open-source programming language. This makes R an ideal choice for many. R provides many worldwide boot camps and workshops.
- Simple and easy to understand – While many may argue that R offers a steep learning curve for the beginners, it is so because R is a statistical language. In order to use R at its best, you need to have experience with statistics. However, R has an easy to understand syntax. This allows you to remember and understand R properly.
4. Important Packages of R for Data Science
Packages in R plays an important role, let’s check some popular and useful Packages –
4.1 ggplot2
R is most famous for its visualization library ggplot2. It provides an aesthetic set of graphics that are also interactive. Ggplot2 comes with many extensions that increase the usability and experience.
4.2 Tidyr
Tidyr is an R package that allows you to clean and organize your data. Tidyr treats the data through the following two properties –
- Every column is treated as a variable.
- Every row is an observation
Using tidyr, you can use three main functions – gather(), spread(), separate() to organize your data into rows and columns.
4.3 Dplyr
Perhaps the most important R library, dplyr allows you to organize, manage and wrangle data. An important feature of dplyr is that it uses a declarative syntax that is easy to remember. Dplyr facilitates various operations like select, modify, filter, mutate, etc.
5. Why is R Important in Data Science?
Some of the important features of R for data science application are –
- R provides various important packages for data wrangling like dplyr, purrr, readxl, google sheets, datapasta, jsonlite, tidyquant, tidyr etc.
- R provides extensive support for statistical modelling. Since Data Science is statistics heavy, R is an ideal tool for implementing various statistical operations on it.
- R is an attractive tool for various data science applications because it provides aesthetic visualization tools like ggplot2, scatterplot3D, lattice, highcharter etc.
- R is heavily used in data science applications for ETL (Extract, Transform, Load). It provides an interface for many databases like SQL and even spreadsheets.
- Another important ability of R is to interface with NoSQL databases and analyze unstructured data. This is very useful in Data Science applications where a pool of data has to be analyzed.
- With R, data scientists can apply machine learning algorithms to gain insights about future events. There are various packages like rpart, CARET, randomForest, and nnet.
Check out the Latest Career Prospects and Future of Data Science
6. What Makes R Suitable For Data Science?
R is the most popular choice for data scientists. Following are some of the key reasons as to why they use R –
- R is reliable and useful in academia for many years. Traditionally, R was used for research purposes at the academy because it provided various statistical tools for analysis. With the advancements in data science and the need for analyzing data, R became a popular choice in the industry as well.
- R is an ideal tool when it comes to data wrangling. It allows the usage of several preprocessed packages that makes data wrangling a lot more easier. This is one of the main reasons as to why R is preferred in the Data Science community.
- R provides its famous ggplot2 package which is most famous for its visualizations. Ggplot2 provides aesthetic visualizations that cater to all the data operations. Furthermore, ggplot2 provides a degree of interactivity to the users so that they can understand the data embedded in the visualization more clearly.
- R contains machine learning packages for various operations. Be it boosting, building random forests or performing regression and classification, machine learning provides a wide array of packages.
7. Data Science Companies that Use R
Some of the major data science companies that use R analysis and statistical modeling are –
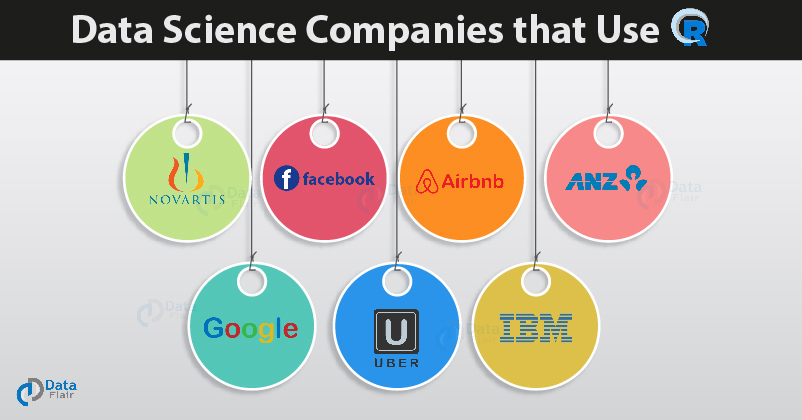
- Facebook – Facebook makes heavy use of R for social network analytics. It uses R for gaining insights about the behavior of the users and establishes relationships between them.
- Airbnb – Supports R for its various day to day data operations. R makes use of the dplyr package for slicing and dicing the data. It also makes use of the graphical package ggplot2 for visualizing the data. Furthermore, it makes use of the pwr package for various experimentations and statistical tests.
- Uber – Uber makes use of the R package shiny for accessing its charting components. Shiny is an interactive web application that is built with R for embedding interactive visual graphics.
- Google – At Google, R is a popular choice for performing many analytical operations. The Google Flu Trends project makes use of R to analyze trends and patterns in searches related to flu. Furthermore, Google’s prediction API makes use of R for analyzing the historical data and make future predictions.
- ANZ – ANZ is one of the largest banks in Australia. It makes use of R for credit risk analytics which involves predicting loan defaults based on transactions and credit score of the customers.
- Novartis – Norvatis is a major pharmaceutical corporation that relies on R for clinical data analysis for the FDA submissions.
- IBM – IBM is one of the major investors in R. It recently joined the R consortium. IBM also utilizes R for developing various analytical solutions. It has used R in IBM Watson – an open computing platform. Furthermore, IBM supports R missions and helps the community to grow through some serious contributions.
You Must Check – Top Data Science Use Cases
8. Summary
In the end, we conclude that R is an ideal programming tool for analysis in Data Science. In this article, we went through the definition of R and also gave the importance of R in data science.
Furthermore, we discussed various features of R and gave an insight into various industries that use R for Data Science. You may also, like to know the major difference between Data Science vs Data Analytics.
Liked our explanation? Share your experience of R for Data Science article in the comment section.
You give me 15 seconds I promise you best tutorials
Please share your happy experience on Google


Very relevant information