T-tests in R – Learn to perform & use it today itself!
We offer you a brighter future with FREE online courses - Start Now!!
In this tutorial, we are going to learn what is T-tests in R. Along with this, we will learn how to perform T-tests in R and its various uses. Also, we will look at various types of T-test in R like one sample and Welch T-test etc.
So, let’s start the tutorial.
What is T-tests in R Programming?
T-tests in R is one of the most common tests in statistics. So, we use it to determine whether the means of two groups are equal to each other. The assumption for the test is that both groups are sampled from normal distributions with equal variances. The null hypothesis is that the two means are equal, and the alternative is that they are not equal. It is known that under the null hypothesis, we can calculate a t-statistic that will follow a t-distribution with n1 + n2 – 2 degrees of freedom.
Welch’s T-test is a user modification of the T-test that adjusts the number of degrees of freedom when the variances are thought not to be equal to each other.
We use t.test() which provides a variety of T-tests:
# independent 2-group T-test
t.test(y~x) # where y is numeric and x is a binary factor
# independent 2-group T-test
t.test(y1,y2) # where y1 and y2 are numeric
# paired T-test
t.test(y1,y2,paired=TRUE) # where y1 & y2 are numeric
# one sample T-test
t.test(y,mu=3) # Ho: mu=3
Understand everything about the R Factor Functions
How to Perform T-tests in R?
We can use the var.equal = TRUE option to specify equal variances and a pooled variance estimate.
You can use them:
alternative=”less” or
alternative=”greater”, option to specify one-tailed test.
1. One-Sample
In R, we use the syntax t.test(y, mu = 0) to conduct one-sample tests in R, where
- x: is the name of our variable of interest and
- mu: mu, which is described by the null hypothesis is set equal to the mean.
For example:
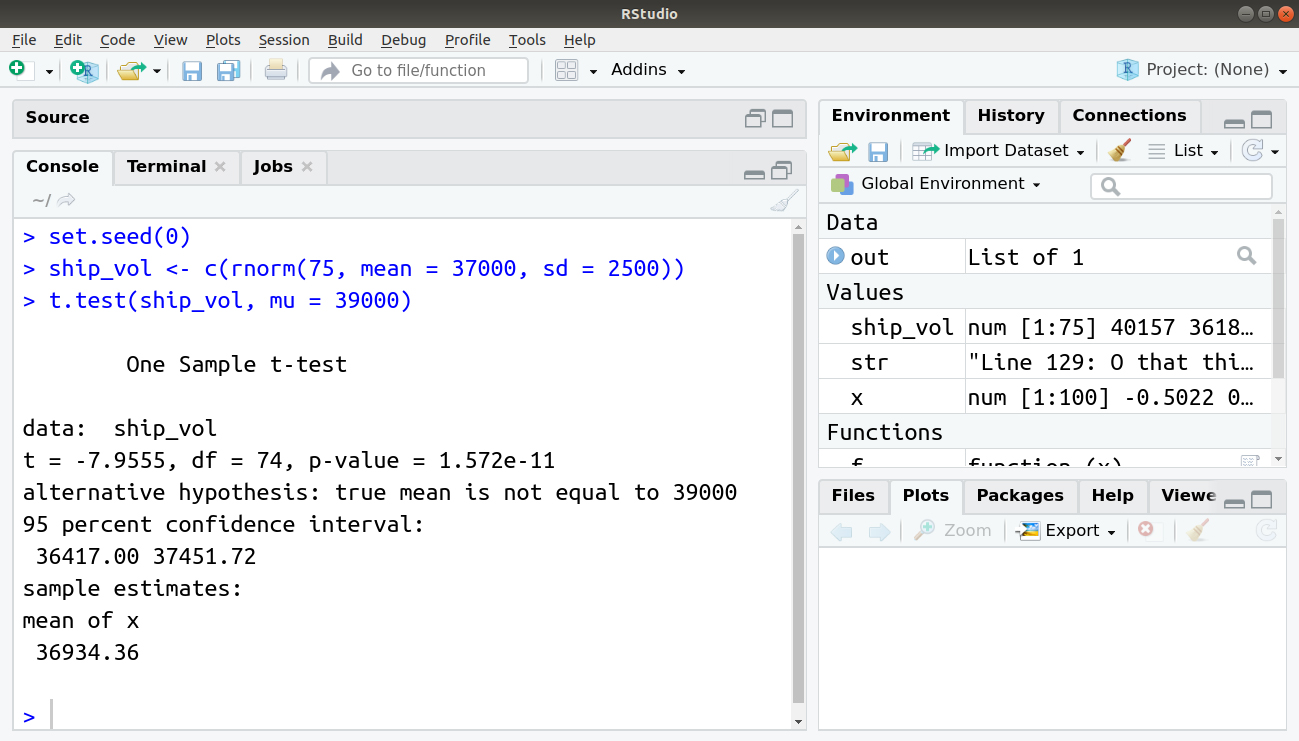
If we wanted to test whether the volume of a shipment of lumber was less than usual (μ0=37000 cubic feet), we would run:
set.seed(0)
ship_vol <- c(rnorm(75, mean = 37000, sd = 2500))
t.test(ship_vol, mu = 39000)
Output:
Wait! Have you checked – Survival Analysis in R Programming
2. Paired Sample
We need either of the two vectors of data, y1 and y2, to conduct a paired-samples test. Then, we will run this code using this using syntax t.test(y1, y2, paired=TRUE).
For instance, let’s say that we work at a large health clinic and we are testing a new drug, Procardia, whose work is to reduce hypertension. We find 13000 individuals with high systolic blood pressure (x¯=150 mmHg, SD=10 mmHg) and we provide them Procardia for a month, and then measure their blood pressure again. We find that the mean systolic blood pressure has decreased to 144 mmHg with a standard deviation of 9 mmHg.
Here, we would conduct a T-test using:
#Author DataFlair
set.seed(2820)
pre_Treatment <- c(rnorm(2000, mean = 150, sd = 10))
post_Treatment <- c(rnorm(2000, mean = 144, sd = 9))
t.test(pre_Treatment, post_Treatment, paired = TRUE)
Output:
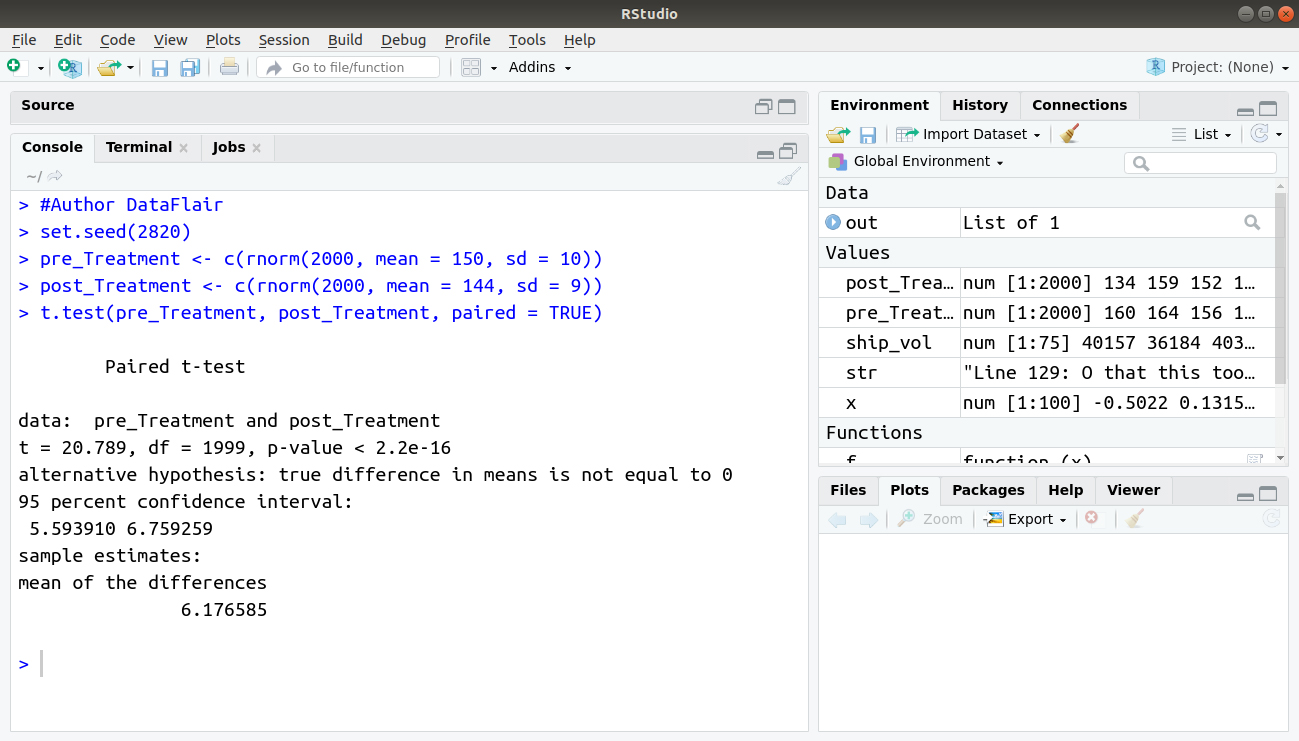
Again, we see that there is a statistically significant difference in means of:
t = 20.789, p-value < 2.2e-16
Don’t forget to check the Predictive and Descriptive Analysis in R
3. Independent Samples
The independent-samples test can take one of three forms, depending on the structure of your data and the equality of their variances. The general form of the test is t.test(y1, y2, paired=FALSE). By default, R assumes that the variances of y1 and y2 are unequal, thus defaulting to Welch’s test. To toggle this, we use the flag, var.equal=TRUE.
In the three examples shown here, we’ll test the hypothesis in which Clevelanders and New Yorkers spend different amounts for eating outside on a monthly basis.
Independent-samples T-test where y1 and y2 are numeric:
#Author DataFlair
set.seed(0)
Spenders_Cleve <- rnorm(60, mean = 350, sd = 77)
Spenders_NY <- rnorm(60, mean = 400, sd = 80)
t.test(Spenders_Cleve, Spenders_NY, var.equal = TRUE)
Output:

Where y1 is numeric and y2 is binary:
#Author DataFlair
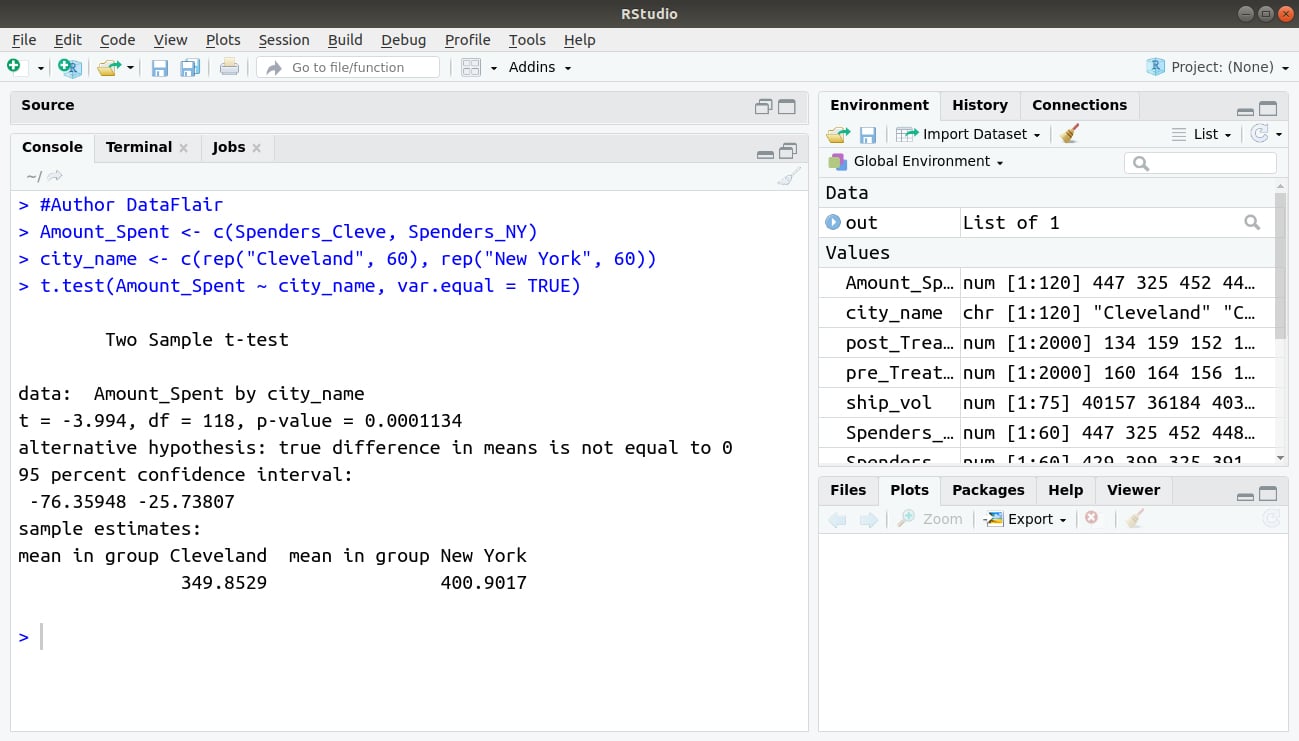
Amount_Spent <- c(Spenders_Cleve, Spenders_NY)
city_name <- c(rep("Cleveland", 60), rep("New York", 60))
t.test(Amount_Spent ~ city_name, var.equal = TRUE)Output:
With equal variances not assumed:
#Author DataFlair
t.test(Spenders_Cleve, Spenders_NY, var.equal = FALSE)
Output:
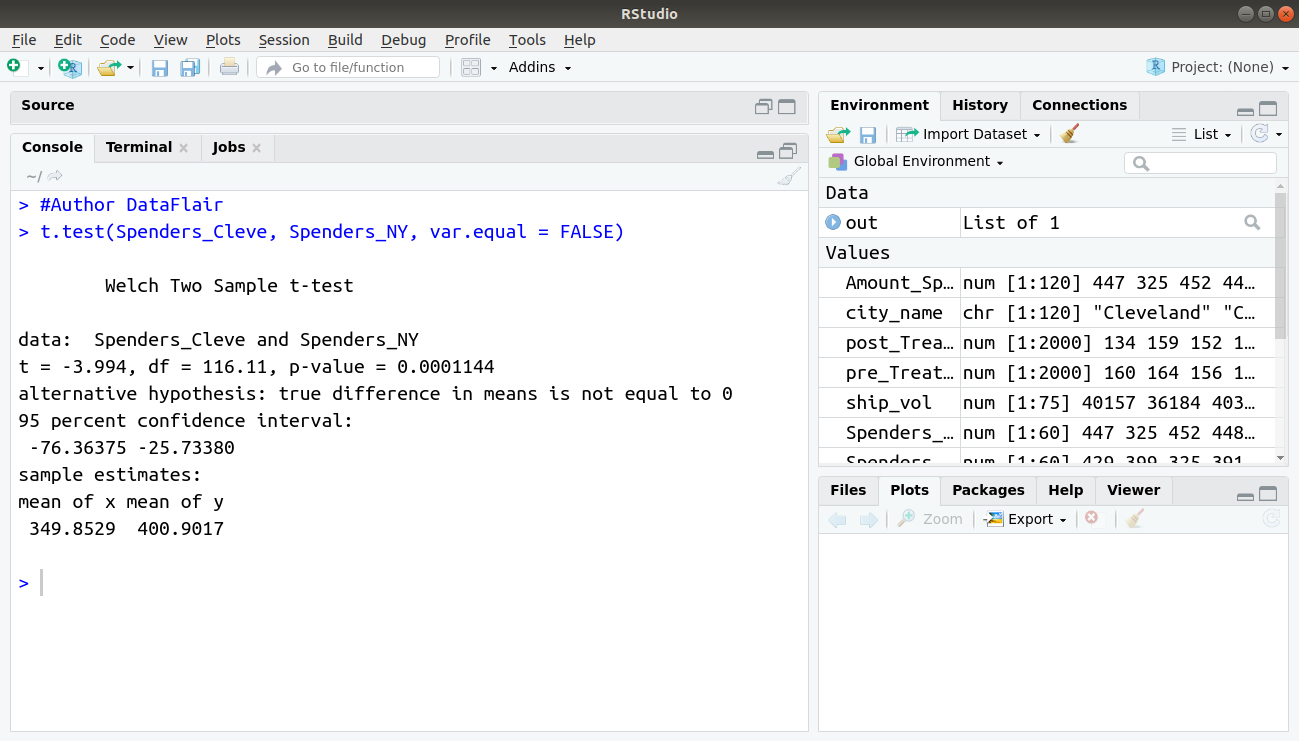
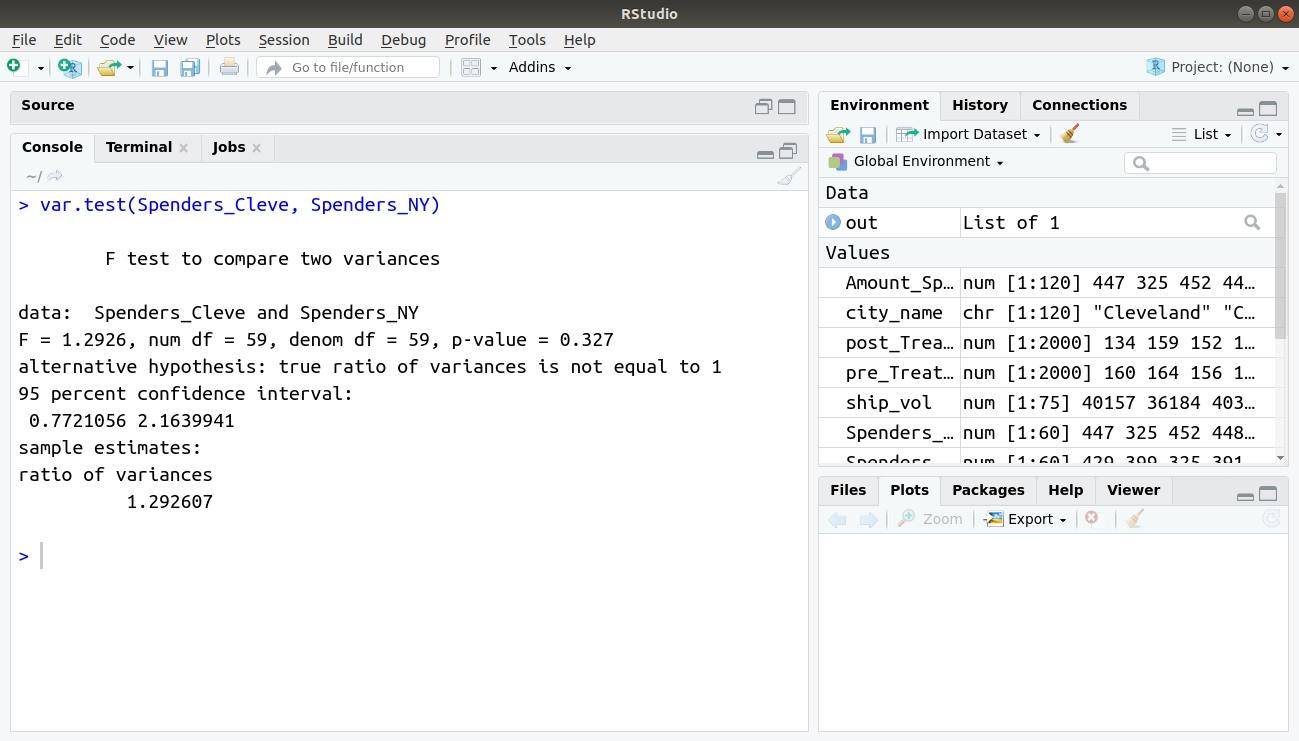
In each case, we see that the results really don’t differ substantially: our simulated data show that in any case, New Yorkers spend more amount each month at restaurants than Clevelanders do. However, if you want to test for equality of variances in your data prior to running an independent-samples T-test, R offers an easy way to do so with the var.test() function:
var.test(Spenders_Cleve, Spenders_NY)
Output:
Do you know – How to Import Data in R
Reasons behind Using T-tests in R
1. Why we use a T-test in R?
It is an analysis of two populations which means a use of statistical examination. It is a type of T-test with two samples being used with small sample sizes. And, testing the difference between the samples when the variances of two normal distributions are not known.
2. What is Welch’s T-test used for?
In statistics, we use Welch’s T-test, which is a two-sample location test. We use it to test the hypothesis such that the two populations have equal means. Welch’s test, which is an adaptation of Student’s T-test is much more robust than the latter. It is more reliable when the two samples have unequal variances and unequal sample sizes.
3. Why we use One-Sample T-test?
We use it only for tests of the sample mean.
4. Why do we use the T-test for research?
We use PowerPoint on T-tests which is made for our use. The T-test is one type of inferential statistics. We use it to determine whether there is a difference between the means of two groups. With the implementation of inferential statistics, we assume the dependent variable fits the normal distribution.
Summary
We have learned about the concept of T-tests in R. We have discussed how to perform different T-tests in R along with its different uses in R. Hope you understood the independent T-test, paired sample T-test, and one sample T-tests in R.
Now, the next tutorial for you – ANOVA in R – Common Statistical ANOVA Models
Still, if you have any queries regarding the tutorial, ask in the comment section.
Your opinion matters
Please write your valuable feedback about DataFlair on Google


Good clarification