Skewness in Qlikview (Statistics) – Types of QlikView Skew
FREE Online Courses: Elevate Your Skills, Zero Cost Attached - Enroll Now!
The last session was on Best practice for Data Modeling in QlikView. Here, we will explore a new topic – QlikView Statistics, in which we study Skewness in QlikView. Along with this, we will learn 3 main types of QlikView Skewness.
By far, we have seen plenty of ways in which we could represent or display data as per our requirement using QlikView tools. But such tools will only represent the data, extracting insights from it is your job.
As an aid to this, there are some statistical tests that you can do on your data in QlikView, that makes drawing insights and discovering patterns from the data very easy. Before we learn about the tests, we must go through some basic statistical concepts as the tests are based on it.
So, let’s start a tutorial of “Skewness in QlikView”.
How to Understand Data Behaviour?
All the data that we load into the data analysis tools like QlikView have hidden patterns and trends which when properly inferred and now reveals.
This is done by understanding the data behaviour by two types of concepts:
- Skewness
- Kurtosis
Both skewness and kurtosis are distinct ways to read and understand data through the shapes of their distribution curves (bell curves).
Do you know QlikView Delimited File (CSV)?
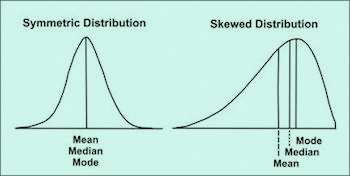
As you might know from your knowledge in statistics that a data set is statistically analyzed by observing the distribution of data and calculating the central tendencies like mean, mode and median. In an ideal situation, the mean of the data set falls exactly in the middle of the distribution curve and is the same as its mode and median.
Such distribution bell curve is called a normal distribution curve. But it is not every time that the conditions are so ideal. Most often than not, there occur variations in the shape of the normal curve causing asymmetry. This asymmetry cause by unusually high and low values of data.
Let us understand this asymmetry in data and how is it perceive in the following sections.
What is Skewness in QlikView?
Skewness is the distortion or asymmetry arising in the distribution curve pushing it to the left or right. The left or the right shift (i.e. skewing) occurs due to the change in data values such that the mean of the data set changes and its position on the graph shifts towards left or right.
What is Skewness in QlikView
Types of Skewness in Qlikview
When you want to draw some inference from a data set or compare data in different situations in QlikView, you do it by making some hypothesis. These hypotheses are the expected results that you think will come from the data analysis. For instance, if you own a car company and last year you launched an advertisement campaign with a famous sports celebrity.
Now, after a year using the sales data, you want to know that whether or not that celebrity advertising your car has brought some increase in sales. In other words, was that decision lucrative for the company? So, in this case, two hypotheses made are; yes, the celebrity advertisements increased the sales, and another is, it did not bring any change, also called Null hypothesis.
Must Read – Types of Operators in QlikView
But what all this has to do with skewness in Qlikview? You ask. Well, skewness in QlikView helps you conduct the statistical tests correctly by deciding what kind of change in the distribution of data (positive or negative) do you expect in the data. We will understand this by implementing this logic in the lessons where we learn about different statistical tests.
For now, let us take a look at the three kinds of skewness in QlikView.
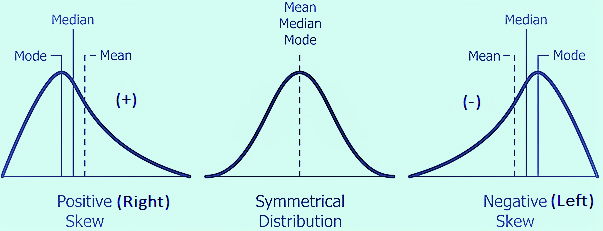
a. Positive Distribution (Right-Skew)
The right skew or positive distribution arises when the mean (average) is increased by some unusually high values making the bell curve shift to the right side and making the value positive. Here, the mean is greater than the median.
Mean > Median
b. Norma Distribution (Zero-Skew)
Normal distribution or zero skew has all the values normal having a symmetric bell curve falling symmetrically on the left and right of the axis. Zero skew distribution has the mean at the centermost point of the bell curve.
Mean = Median
c. Negative Distribution (Left-Skew)
The negative distribution or left skew arises when the mean of data decrease by some unusually low data values shifting the curve to the left.
Mean < Median
Skewness in QlikView – Negative Distribution
So, this was all about skewness in QlikView. Hope you like our explanation.
Conclusion
This is all you need to know about the concept of skewness in QlikView. We will learn how to apply this concept while doing statistical tests in QlikView. Furthermore, if you have any queries, do leave them in the comment section below.
Related Topic – How to Define Concatenate in QlikView
We work very hard to provide you quality material
Could you take 15 seconds and share your happy experience on Google

