Learn Power BI – Comprehensive Power BI Tutorial Series for Beginners
FREE Online Courses: Dive into Knowledge for Free. Learn More!
Learn Power BI with A-Z Guide
Before you set your mind to learn new technology, it is important for you to know exactly how to advance in your journey of learning. You need to have a map in your head telling you where to start from, which points to cover and where to finally end. Because when you are learning something new, it is very important that you make gradual progress and not dive straight in and learn everything at once.
In this master guide for Power BI, we bring to you a breakdown of important topics that you need to cover. Power BI is a multi-faceted and extremely interesting business intelligence tool used for data analysis by a vast user base. So begin your Power BI journey with going through this master guide first and then commence with learning interesting Power BI topics.
Master Power BI from Scratch
In order to cover all the topics from our Power BI tutorial, you need to work out a plan as to how to progress about this tutorial beginning with learning easier and conceptual topics and then gradually moving on to advanced level topics.
To help you out with this, we have created a list of topics according to three levels of difficulty that is beginners, intermediate and advanced. We would suggest that it would be better if you follow this tutorial and learn the topics in the order suggested in the list given below for each level.
Power BI Topics for Beginners
- Introduction
- Features
- Architecture
- Pros and cons
- Data Modeling
- Dashboards in Power BI
- Power BI Desktop
- Data sources
- Admin Roles
- Report Server
- Tables
- Case studies
- Books
Power BI Topics for Intermediates
- Gateways
- Filters
- Queries
- Slicers
- KPIs
- Mobile apps
- Custom visuals
- Bookmarks
- Measures
- Power BI Vs SSRS
- Security
Power BI Topics for Advanced Learners
- Charts
- Analytics pane
- Relationship views
- API
- DAX
- Interview questions
Now that you must have gone through the topic list, you can also go through the notes for the topics provided in the list to understand them in a little depth.
Learn Power BI – Beginner Level Topics
1. Power BI Introduction
The “Power BI Tutorial” article will give you a good head start and set your momentum for learning Power BI in the days to come. This introduction gives you a general overview which tells us about the concept behind Power BI, its history, features, components, architecture, user types, data connections and a lot more. So, from this article, you can decide whether or not Power BI is the right technology for your data analysis requirements.
2. Power BI Features
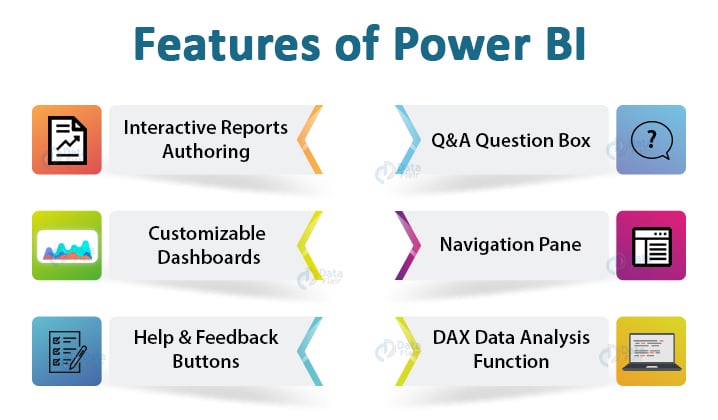
The best and quickest way to gain knowledge about something new is by going through a list of features that technology is offering to its users. You can learn about interesting Power BI features such as Get data, visualizations, filters, dashboards, navigation pane, reports, natural language Q&A box and much more in our article on Power BI features.
3. Power BI Architecture
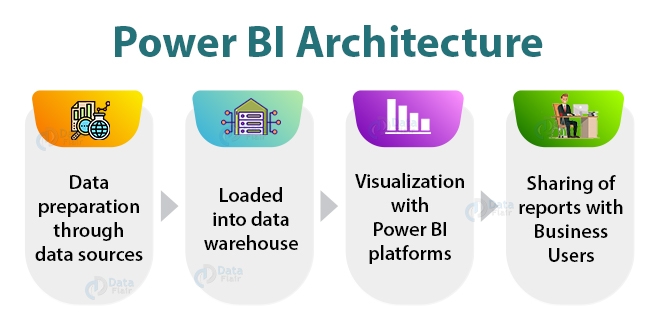
Whenever we try to learn new software or technology, we cannot do it properly without understanding what’s under the hood. To understand the working of Power BI, read the Power BI Architecture topic. Here, you will get to learn about the basic flow of processes, components, their working and workings at the front and back ends of the entire system.
4. Pros and Cons of Power BI
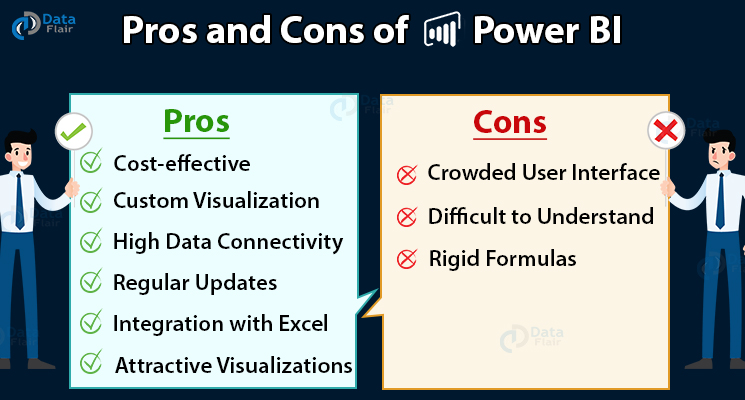
To get a perfect analysis of technology, you need to know about both its advantages as well as disadvantages. In our tutorial on Power BI, we provide to you a comparative account of the pros and cons of Power BI. From this particular article, you can find out in minutes what exactly Power BI is good in and what areas still need a little attention and prepare yourself accordingly.
5. Power BI Data Modeling
One basic functionality every BI software should have is data modeling. Data modeling enables you to create a proper logic and structure to assess and process the data you use in Power BI. Through data modeling, we can form associations between different data sources and define a logic, select a certain set of data from the source and perform calculations, apply a set of rules on it. Thus, by learning data modeling, you learn a very important aspect of data analysis that is creating a systematic conceptual representation or a blueprint that governs how the incoming data should be treated.
Practical: Implement Data Modeling in Power BI
6. Dashboards in Power BI
The real strength of a good BI tool is how dynamic and interactive its dashboards are. In other words, a BI tool is judged by its ability and ease with which it enables its users to visually represent their data. Power BI is known for its attractive and easy to create dashboards that provide an overview or storyline of a report. In the articles “Create Dashboards”, “Share Dashboards” and “View Dashboards”, you can learn everything you need to know about dashboards.
7. Power BI Desktop
We just saw how important dashboards are for a good BI tool like Power BI. Now, in order to learn how to create and work with dashboards, we need a platform that could run on our systems where we can perform all the tasks. Power BI Desktop is a free development, authoring, and publishing tool of Power BI. It is a user interaction platform used to connect to multiple data sources, transform the data and clean it, visualize it and create reports.
Practical: Install and Use Power BI Desktop
8. Data Sources for Power BI
Learning a business intelligence tool or data analytics tool is incomplete without having good knowledge about how it deals with the data sources. All the data being used Power BI originates from its respective data sources. With the help of two articles on “Connect to Data in Power BI Desktop” and “Data Sources for Power BI”, you can learn how to establish a connection with any kind of data source in Power BI and the different types of data sources available.
9. Power BI Administration and Admin Roles
From the “Power BI Admin Roles (Power BI Administration)” article, you can get a good understanding of how the administration is carried out in Power BI and what are the roles and responsibilities granted to the Admin.
10. Power BI Report Server
As you start to move past the basics of Power BI, you start to encounter interesting topics like the report server. Power BI Report Server is an on-premises report server which is used in hosting Power BI reports. The reports hosted on the on-premises report server are displayed to the users via a web portal. Refer to our “Power BI Report Server” article to learn about the features, installation, working/architecture, components and much more about the Power BI Report Server.
11. Tables in Power BI
Tables are the most basic form of representing data. Power BI provides you with a lot of unique features and functionalities around working with tables. In our article “Table in Power BI Dashboards and Reports” you get to learn how to create a table, arrange it and apply further logics on it.
12. Power BI Case studies
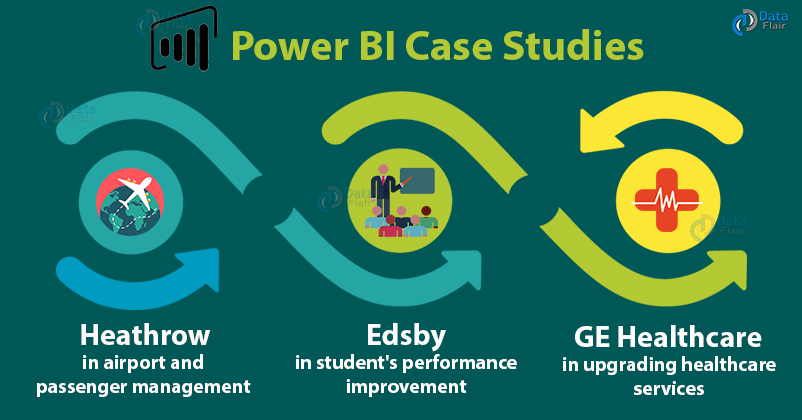
By now, you have gained enough theoretical knowledge about Power BI which has laid a good base for the rest of it to build upon. Before we move on to next level topics, we suggest you go through some interesting case studies on Power BI. These case studies represent the usefulness and application of this BI technology in real-life scenarios. We have meticulously brought together case studies of three companies or groups; Heathrow, GE Healthcare and Edsby. One interesting thing to note here is all the three case studies show the effectiveness of Power BI in three different sectors.
13. Career in Power BI
One thing we are sure of by now is that if you have completed the beginners level and want to learn more about the technology and level up your knowledge on Power BI, you are probably not just doing it for fun. You would want to bring this knowledge into practice and consider Power BI as a career option. To answer all your questions regarding a career in Power BI, we have the article “Power BI Career Opportunities“. This article covers topics like average salaries, market share, top companies using Power BI, top industries using Power BI, career trends in India and much more.
14. Books on Power BI
Our “Best Power BI Books” article covers all the important books you need to know if you wish to get a thorough understanding of Power BI.
Learn Power BI – Intermediate Level Topics
On the intermediate level, you will get to learn a lot of interesting features and functionalities of Power BI. We are sure by now you must have gotten intrigued by Power BI and want to know more about its capabilities. Follow the notes brought together by us only for you to get an idea of what to expect on the intermediate level learning of Power BI.
1. Power BI Gateways
After learning about how data is uploaded and used in Power BI and processes like connecting to data sources. There is another feature related to such data sources that reside on-premise known as Gateways. Power BI Gateway is a software that is used to access data situated in an on-premises network. We can say that it acts as a gatekeeper for the on-premises data source. If anyone needs to access on-premises data from a cloud or web-based app, the request goes through the gateway. The gateway attends all the connection requests and grants access based on their authentication and requirements.
Therefore, we can say that gateways play an important role in the overall functioning of Power BI. In our “Power BI Gateway” article, you will get to learn the concept of gateways, their types, working/architecture, how to use it, how to install it, and a lot more.
2. Power BI Filters
Knowing well about filters is an important factor in learning any BI tool as they make the data analysis process very dynamic. Filters allow us to select and work on a selected set of data instead of the entire data set. Along with this, you can use the filters in creative ways as per your business requirements. From our “Types of Filters” and “Power BI Filter Addition” article, you can learn about Power BI filters, working with them in Power BI with examples and different types of filters.
3. Power BI Queries
No matter how advanced a BI software is, we would always want our reports to have a personal touch. The queries feature in Power BI lets you design your own SQL queries that you can apply on your data at the source. This is a very useful feature allowing you to enter your own queries in Power BI. From our “Power BI Query” article, you can learn all you need to know about Power BI queries as well as the query editor.
4. Power BI Slicers
The intermediate level is full of unique features of Power BI like the Slicers. Slicers are like visual filters that enable the users to apply filters while working on a report. You can learn about slicers so that you can use it in your report analysis as it makes it very easy, fast and convenient.
Practical: Create Slicer in Power BI Desktop
4. Power BI KPIs
KPIs or Key Performance Indicators are another important visual feature available in Power BI. The KPIs evaluate the performance in different areas by evaluating quantifiable measure values and measurable goals. In businesses, KPIs play an essential role as they provide visual cues indicating the growth of an organization. Learn everything about KPIs from our “Power BI KPI” article.
5. Power BI Mobile apps
Power BI on your mobile? Sounds cool right! You can create Power BI applications that can run on mobile devices. Power BI offers an arrangement of mobile applications for iOS, Android, and Windows 10 mobile gadgets. In mobile applications, there is an interface associated with your cloud and on-premises information.
Get a deep understanding of Power BI Mobile Apps
6. Custom Visuals in Power BI
Another exciting feature of Power BI is its custom visuals library. Along with the in-built or pre-packaged visualizations available in Power BI for you to use them any time while creating your dashboards. You can also add new visualizations known as custom visuals from a library or a marketplace (as it is called). Learn more about custom visuals or marketplace visuals of Power BI from a dedicated article on custom visualizations in Power BI.
7. Power BI Bookmarks
While working with your data in Power BI, you will realize the usefulness of bookmarks. Power BI Bookmarks are used to capture the present configured view of a report page, along with the fliers and visuals. We can use the bookmarks to track our progress in the reports or save time from creating the same thing again and again. Learn further about bookmarks like what are bookmarks, creating books, using bookmarks and much more from our tutorial on it – Power BI Bookmarks
8. Measures in Power BI
The ability to create your own measure fields in Power BI is another blessing from Power BI for its users. You will often come across situations while working with data in Power BI where the measure fields available in the database are not enough to represent the data in which you want to represent it. As a solution, Power BI gives you the option to create measures as per your requirements. Measures allow us to create advanced solutions and models in Power BI for data analysis and reporting. They perform real-time calculations based on your interactions with data on your report.
Practical: Create Measures in Power BI Desktop
9. Power BI Vs SSRS
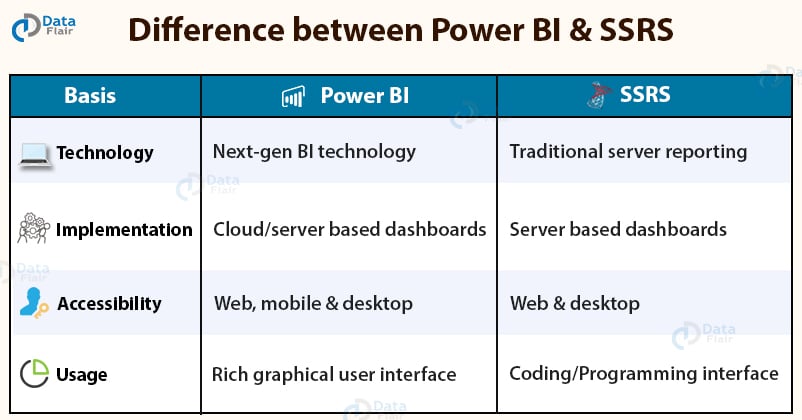
Now that we have covered about 75% of the Power BI tutorial, we know enough about it to be able to understand its comparison from a similar or competitor technology. For this, go through the comparative study of Power BI against the SQL Service Reporting Service (SSRS) in order to understand Power BI even better.
10. Security in Power BI
You might ask, how is our confidential and important data safe while we work on Power BI. The answer to this is available in the “Power BI Security” article.
Learn Power BI – Advanced Topics
1. Power BI Charts
BI software is incomplete without its charts and visualizations. In the advanced level of Power BI tutorial, you will get in-depth knowledge with examples of a wide range of Power BI charts. Learn how to create and use charts like:
- Scatter and Bubble Chart
- Area Chart
- Funnel Chart
- Combo Chart
- Donut Chart
- Radial Gauge Chart
- Waterfall Chart
- Ribbon Chart
- Time Series Charts
2. Power BI Analytics pane
After learning about charts in Power BI, you can move a step further and learn about some advanced functionalities that are available in the analytics pane of Power BI. In this pane, you will get options like adding reference lines, highlighting data trends and many more. You can add complex and advanced layers of detail with the help of analytics pane on your data visuals. This will make your data analysis report more meaningful as well as insightful for the readers and analysts.
Practical: Use Analytics Pane in Power BI Desktop
3. Relationship Views in Power BI
Often times when you work with large data sets or combine data from multiple data sources, you feel the need to view the entire web of data connections and relations between them in a single view. Power BI has yet another amazing feature of relationship views where you can view your entire data model along with its elements such as tables, connections, segments, etc.
4. Power BI API
If you belong to a technical background, you must be well aware of what APIs are. And even if you have no clue, no worries, we have got you covered! In our “Power BI API” article, you can learn in-depth about the Application Program Interface (API) related functionalities of Power BI.
5. DAX in Power BI
Last, but not the least is our Data Analysis Expressions topic made short as DAX. DAX expressions or formulas that are used to perform complex logic and calculations in Power BI data analysis. Such expressions are a unique combination of functions, operators, and constants that are evaluated as one formula to yield results (value or values). DAX formulas are very useful in BI tools like Power BI as they help data analysts to use their data to the fullest potential.
Practical: Create Measure Formula using DAX
6. Power BI Interview Question and Quiz Series
The final step in our journey of learning Power BI from scratch is to test our knowledge. We have provided a series involving two sets of interview questions on Power BI which will polish your knowledge and prepare you to begin your Power BI journey at a professional front.
Along with this, there are sets of quiz questions to test your knowledge of Power BI:
Summary
In our master guide, we covered a list of topics to learn Power BI for beginners, intermediate and expert or advanced levels. Followed by this, we have explained each topic within these three levels in a little detail which is enough for you to get an idea of what to expect while learning the topic. We hope this master guide proved to be helpful and eased up the process of learning Power BI from start to end for you.
How was the Power BI master guide? Was it useful for you? Do mention your views regarding it in the comments.
Happy learning and good luck!
Did you like this article? If Yes, please give DataFlair 5 Stars on Google

