60+ R Interview Questions and Answers [New] – Clear your technical round
FREE Online Courses: Enroll Now, Thank us Later!
Prepared your resume for Data Science Job? Started applying? If yes, then you landed on the correct page. This is the right time you need to start preparing for your upcoming Data Science Interviews. And DataFlair’s this series of R Interview Questions and Answers will help you to crack your next job interview. Our series consists of 2 parts –
- R Language Interview Questions and Answers for Freshers
- R Language Interview Questions and Answers for Intermediate Level
- R Language Interview Questions and Answers for Experienced
In our first part, you will see some basic level interview questions on R which will test your fundamental knowledge along with some most asked R technical interview questions. In our second part, you can practice 31 best R coding interview questions. DataFlair is devoted to help their learners become successful in their data science career.
This was just a brief to DataFlair’s latest R Interview Questions and Answers Series.
Welcome to the first part – Interview Questions on R for Data Scientist
Top R Interview Questions with Answers
Q.1. When should you apply “next” statement in R? When is it appropriate to use the “next” statement in R?
A data scientist will use next to skip an iteration in a loop. As an example:
> val1 <- 1:30
> for(val in val1){
+ if(val == 25){
+ next
+ }
+ print(val)
+ }
This piece of code will iterate through the numbers from 1 to 30. It will skip 25 as we have used the next statement to skip the iteration from which we move on to the next value. We will obtain the output from 1-24 and 26-30.
Q.2 What is the value of equation1(3) for the following R code?
> num <- 4
> equation1 <- function (val)
+ {
+ num <- 3
+ num^3 + g (val)
+ }
> equation2 <- function (val)
+ {
+ val*num
+ }

}
For the above code snippet, we obtain the output as 39.
Q.3 What arguments are required in the R6Class?
In order to create an R6 class in R, the following arguments are required –
- The first argument in the R6 class is the classname itself. It improves the error messages and allows us to make use of R6 objects with the given S3 generics.
- The second argument of the R6 argument is ‘public’. This argument provides several methods and fields which make use of snake_case.
Did you answer the above question? If no, you can revise the concept of arguments in R with DataFlair’s detailed guide.
Q.4 R suffers from the disadvantage of being restricted to the local memory. Could you elaborate the precise memory limit in R?
For a 32-bit, R program is executed, the maximum value that can be obtained is under 4 GB.
Furthermore, for systems that are 64-bits, the limit is just 8 TB.
Q.5 regmatches(number, gregexpr(pattern = “2.?2”,text = number)) Is this an example of non-greedy quantifier? If yes, then why and what would be the equivalent greedy quantifier?
No. This is an example of a non-greedy quantifier. An equivalent greedy approach would be –
regmatches(number, gregexpr(pattern = "2.*2",text = number)) .
Suppose that for a given number, val1 = 2020000200
The greedy approach would initiate from the first digit ‘2’. It then moves ahead and encounters the second digit ‘2’. It keeps searching for another ‘2’ digit which it also encounters. However, it does not find any more digits after that and hence, it returns the value: 20200002.
A non-greedy approach on the other hand, stops at the first match and returns us the value of 202.
Q.6 A csv file consists of missing values that are represented by hashtags (“#”) and ampersands (“&”). How can you read this type of a csv file in R?
We can read this type of data with the following line of code –
csv2(‘data-file.csv’,header=FALSE,sep=’,’,na.strings=c(‘#’,’&’))
Q.7 Suppose that you have an array consisting of several objects. This object is of the type string. Let this string be “DataFlair”. Now, you want to find the location of this string in the character array ‘arr’. How will you carry this out?
which( arr == “DataFlair”)
Learn everything about R arrays in detail
Q.8 Suppose that while writing the R code that consists of multiple functions. While executing the code, there is an error within one of the functions present in the code. What command will you use to find the function that is facing problem?
traceback()
Q.9 You are solving a data science problem that is ridden with many missing values. You want to clean the data before fitting your model. What would you do to replace these missing values? Develop your own function.
Let’s take this vector:
arr<-c(1,2,4,NA,NA,11,NA,10)
Now, let’s write the function to impute the values:
missing_mean <- function(arr){
ifelse(is.na(arr),mean(arr,na.rm = T),arr)
}
Don’t forget to check DataFlair’s detailed tutorial on R Vectors
Q.10 You have been assigned the task of reshaping the data wherein you have to convert the wide format data into long format data and vice versa. How will you carry out this operation?
melt() and dcast()
Q.11 You have two tables “employee_salary” and “employee_experience”. The first table consists of two columns “Name” and “Salary”. The second table consists of “Name” and “Experience” columns. How will you merge these two tables to create a single table that does not have any redundant column in it?
In order to join these two tables, we will have to perform their cross-product. R provides the function “merge” that can be used for the same.
merge(employee_salary,employee_experience,by=NULL)
Q.12 How will you use rattle package in R?
Rattle package provides a graphical user interface to the other R packages provides functionality for data mining operations. After installing the Rattle Package, we type rattle() in the R Studio’s Script Panel.
rattle()
Q.13 How do tibbles differ from the traditional data-frames?
The two main areas that differentiate tibble from the traditional data-frames are – printing and subsetting:
Tibbles consists of a refined print method that displays the first 10 rows as well as the columns that can be fit on the screen. This facilitates easy working with the large data. In addition to the name, each column reports the type of tibble.
The second area where Tibbles differ from data-frames is subsetting. Tibbles have a strict notion about subsetting. If we access a variable that does not exist, we will get an error.
Q.14 How is seq_along(5) different from seq(5)?
The seq_along(6) will result in a vector that has a length of 6 whereas seq(6) will deliver us a consecutive vector from 1 to 6c( (1,2,3,4,5,6)).
Q.15 Suppose that I want to convert factor to number. I write the following code:
fac <- factor(c(2.3, 1.5, 3, 4.9))

as.numeric(fac)
I obtain the output as – 2,1,3,4 which is clearly not what was expected. How should I rectify this problem?
In the above code, you are converting factor to number which is problematic. R simply floors the values without any warning. In order to convert factors to numbers properly, we use the integer vector to perform indexing on the factor levels as follows –
levels(fac)[fac]
Have you checked R factor analysis
Q.16 Suppose that I want to know the values in c(1, 2, 6, 3, 19) that are not present in c(2, 6, 14, 3, 15). How can you carry this out using built-in function as well as without it?
There are two methods to execute this problem –
- By using setdiff() function – setdiff(c(1, 2, 6, 3, 19), c(2, 6, 14, 3, 15)) and,
- Through the %in% as – c(1, 4, 5, 9, 10)[!c(1, 4, 5, 9, 10) %in% c(1, 5, 10, 11, 13)
Q.17
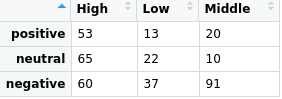
The above data table is written to a csv file called ‘Datatable.csv’. Suppose you want to read this csv file with all 3 rows. How will you carry this out?
csv2(‘Datatable.csv’,header=FALSE,sep=’,’)
Q.18 You have a dataset from which you want to extract a subset. For example, for a data consisting of employee details, you want to create a subset of employees who are above 30 years and who make salary less than 10,000. How will you execute this in R? The salary dataframe be denoted by the variable ‘age’ and the data is contained within the variable ‘employee_data’.
To create a subset of employees older than 30, we will make use of the filter() function as follows –
filter(employee_data, age >30 1, salary < 10000)
Q.19 Suppose you have a vector of numbers vec <- (1,3,4,7) that needs to be combined with the symbols (“#”,”?”) consecutively such that we obtain the output 1-#, 3-?, 4-#, 7-? How will you proceed with this?
Ans. We will use the paste() function as follows –
paste(vec,c("#","?"),sep = "-")Q.20 What are the differences between t.test() and t.data.frame()? When do you use these two functions?
Ans. Due to the naming scheme of S3’s generic class, both functions are similar to one another. However, they are not related to each other.
- t.test() performs t-test and is generic in nature.
- t.data.frame() is called by the generic t() for transposing the input data.
As a result of S3 dispatch rules, t.test() along with t() would get called when the latter is applied to the class “test”
Q.21 What does the following code denote about index updation?
for (index in 1:3) {
index <- index * 2
print(index)
}
Ans. In a for-loop the index is updated at the beginning of each iteration. Therefore, reassigning the index symbol during one iteration doesn’t affect the following iterations.
Q.22 Why do we obtain five missing values from the following lines of code?
x <- 1:5
x[NA]
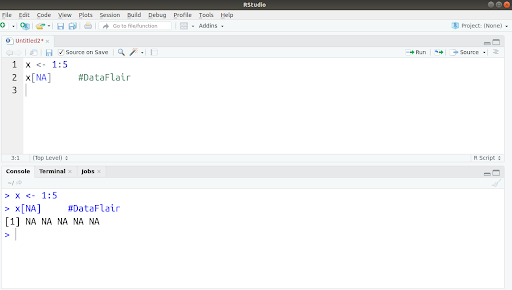
Ans. NA is a logical type object and the logical vectors are reused to the equal length shared between vector and its subset. For example, x[NA] when iterated five times becomes x[NA, NA, NA, NA, NA].
Q.23 Is it possible to model transitioning data like time-zone or a working directory? State reason behind your answer.
Ans. No. S3 models are not adept at capturing models that transition over a period of time. This is because the S3 methods are designed to take the exact input and provide the same result.
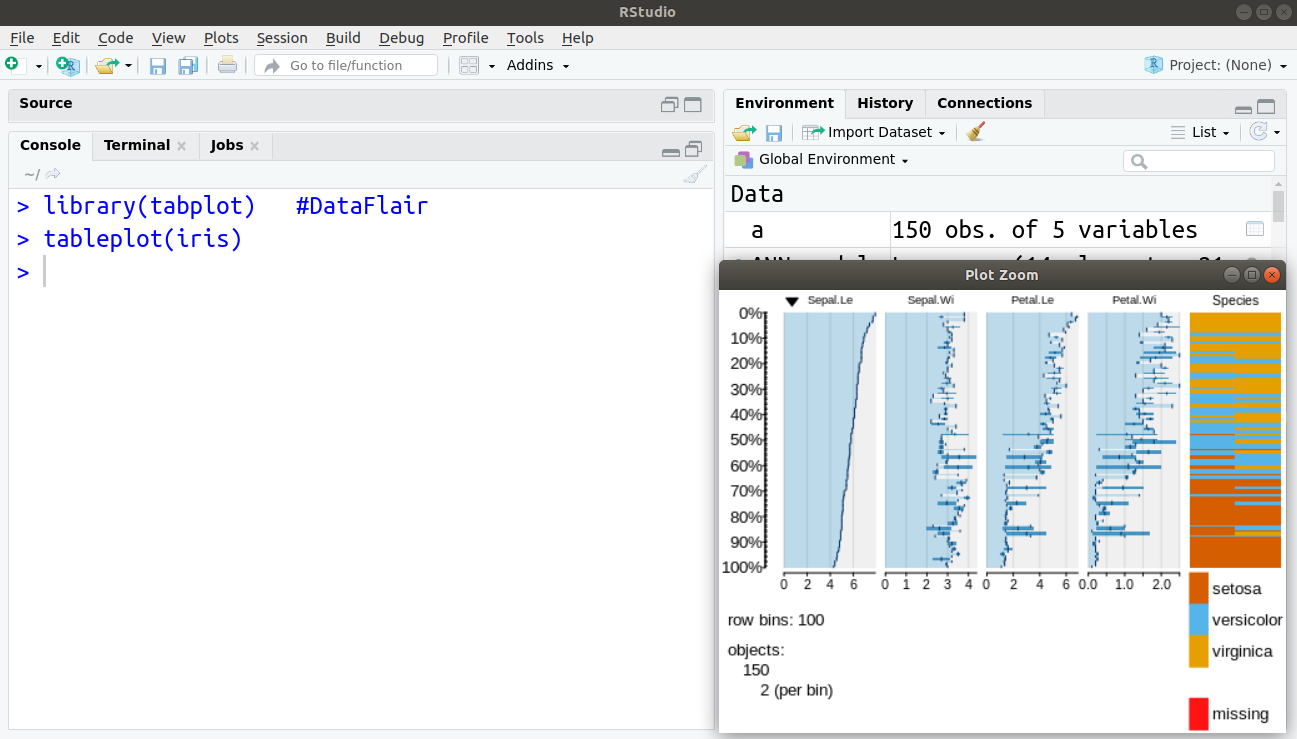
Q.24 Is it possible to plot all the features of a dataset at once? If so, how?
Ans.
> library(tabplot) #DataFlair
> tableplot(iris)
Q.25 What are is.atomic(), is.vector() and is.numeric() functions responsible for?
Ans. These three functions are responsible for –
- The role of is.atomic is to test if the vector is atomic in nature.
- Is.numeric checks if the object has an integer or a double type and does not belong to “factor”, “Data”, “POSIXt” or “difftime” class.
- is.vector() is responsible for testing if the object is vector and therefore, has no attributes excluding names.
Recommended Reading – R Functions Tutorial
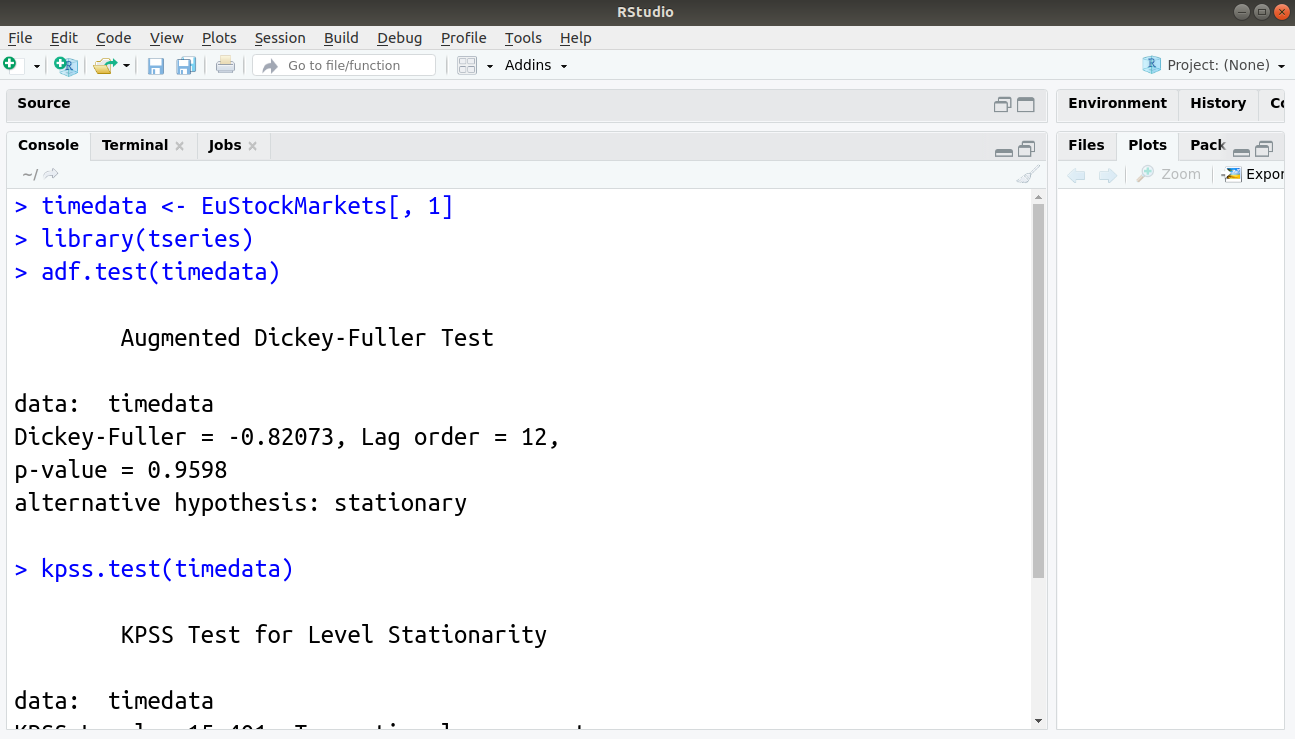
Q.26 How can we test if the time-series model is stationary in R? Take the first column and all the rows of EuStockMarkets as your time-series data.
Ans. For testing if the time-series model is stationary, we make use of the Augmented Dickey Fuller Test (adf test). If the p-value is below 0.05, then that model is stationary. We can implement this in R as follows –
library(tseries)
adf.test(timedata)
kpss.test(timedata)
Q.27 How will you explain R programming to person from a non-technical background?
Ans. R is a programming language that many data analysts, data scientists, statisticians utilize to analyze data and perform statistical analysis using graphs and other forms of visualizations. Using R, one can analyze large datasets. It is an ever-expanding programming language with thousands of packages that provide support to a variety of applications.
This is the frequently asked R interview question. You can learn or master any concept in R with DataFlair’s Free R Tutorials Library
Q.28 Suppose your data science project requires the installation of the ggplot2 package. How will you install it?
Ans. We can perform installation of R packages using a common syntax –
install.packages(“package-name”). In the case of ggplot2, it will be -
install.packages(“ggplot2”)
Practice the latest Data Science Projects for your upcoming interviews.
Q.29 What is RShiny. What are the several advantages of using it?
Ans. Using the Shiny package, you can build interactive web applications. Following are the advantages of RShiny.
- Shiny allows the R developers to develop interactive data visualizations that can directly be hosted on the web.
- It facilitates dis-intermediation of the relationship between data scientists and the business user as it allows high fidelity relations and high-quality data experience.
- It helps to create appealing visualizations, overcoming the cost of proprietary BI tools.
- You can avail any package in R to solve your problem with the Shiny framework.
- RShiny advocates for an open-source ecosystem for JavaScript visualization. With this, you can customize high-quality applications.
- It can be hosted behind firewalls with RStudio Connect or with Shiny Server Pro. These are highly scalable and can support thousands of concurrent users. Furthermore, with these products, you can have security, support, and other professional features.
Q.30 What do you know about RMarkdown?
Ans. RMarkdown provides a notebook interface to the R user. We generally use it to produce high-quality reports for sharing it with the audience. It supports several static as well as dynamic output formats. Using RMarkdown, one can present the code alongside its output (graph, plot, tables) with conventional text to explain the program. The RMarkdown makes use of the Markdown syntax which is a markup language providing methods for the creation of documents with header, links, images etc. from the plain text files while maintaining the original plain text.
Q.31 What are the various sorting functions available in R?
Ans. R provides us with the sort() function that we can use for carrying out sorting of the data. Within this function, there are several parameters through which different sorting operations can be carried out. R provides support for two types of sorting –
The first type of sort is comparison-based sorting wherein the algorithm compares key values of the input vector with the other input which takes place before ordering the data.
Non-comparison based sorting is the second type where the algorithm performs computation on each key-value which then proceeds to perform ordering on the computed values.
The three sorting algorithms are –
>Insertion sort
>Bubble sort
>Selection sort
- Shell sort
- Heapsort
- Quicksort
- Merge sort
- Bin sort and radix sort
So, these were some of the R interview questions with answers that will help you to crack your upcoming interview. For the remaining R technical interview questions refer to the next part of this series – R Programming Interview Questions and Answers.
Conclusion
So, how many questions you have answered on your own. If you want to go ahead of all the other aspirants then you can practice these top data science interview questions and answers.
Most of the Data Scientists recommend practicing at least 3 projects in R before facing the interview. You can check the top projects on our website along with their source code.
All the best!
If you are Happy with DataFlair, do not forget to make us happy with your positive feedback on Google


What was the value of g(val) in the 2nd question posted?