Data Structures in R – The most essential concept for R Aspirants!
We offer you a brighter future with FREE online courses - Start Now!!
In this article, we will study the different types of data structures in R programming. We will also understand their use and implementation with the help of examples.
Without wasting any time, let’s quickly start.
Introduction to Data Structures in R
In any programming language, if you are doing programming, you need to use different variables to store different data. Moreover, variables are reserved in a memory location to store values. Also, this implies that, once you create a variable you reserve some area in memory. Further, data structures are the only way of arranging data so it can be used efficiently on a computer.
If we see in contrast to different programming languages like C and Java, R doesn’t have variables declared as some data type. Further, the variables are appointed with R-objects and the knowledge form of the R-object becomes the datatype of the variable. There are many types of R-objects. The popularly used ones are:
- Vector
- Matrix
- Array
- Lists
- Data Frames
Now, we will discuss each of these R-objects in brief.
1. R Vector
Vector is the most basic data structure in R programming language. It comes in two parts: Atomic vectors and Lists. They have three common properties:
- Type function – what actually it is?
- Length function – how many elements does it contain.
- Attribute function – extra arbitrary metadata.
These elements have different types. For instance, atomic vectors must share the same type. On the contrary, elements that are present in a list can have different data types. We have discussed every concept of R List in our previous article, here we are going to understand only Atomic Vectors.
Atomic Vectors
There are four common types of R Atomic Vectors:
- Numeric Data Type
- Integer Data Type
- Character Data Type
- Logical Data Type
2. R Matrix
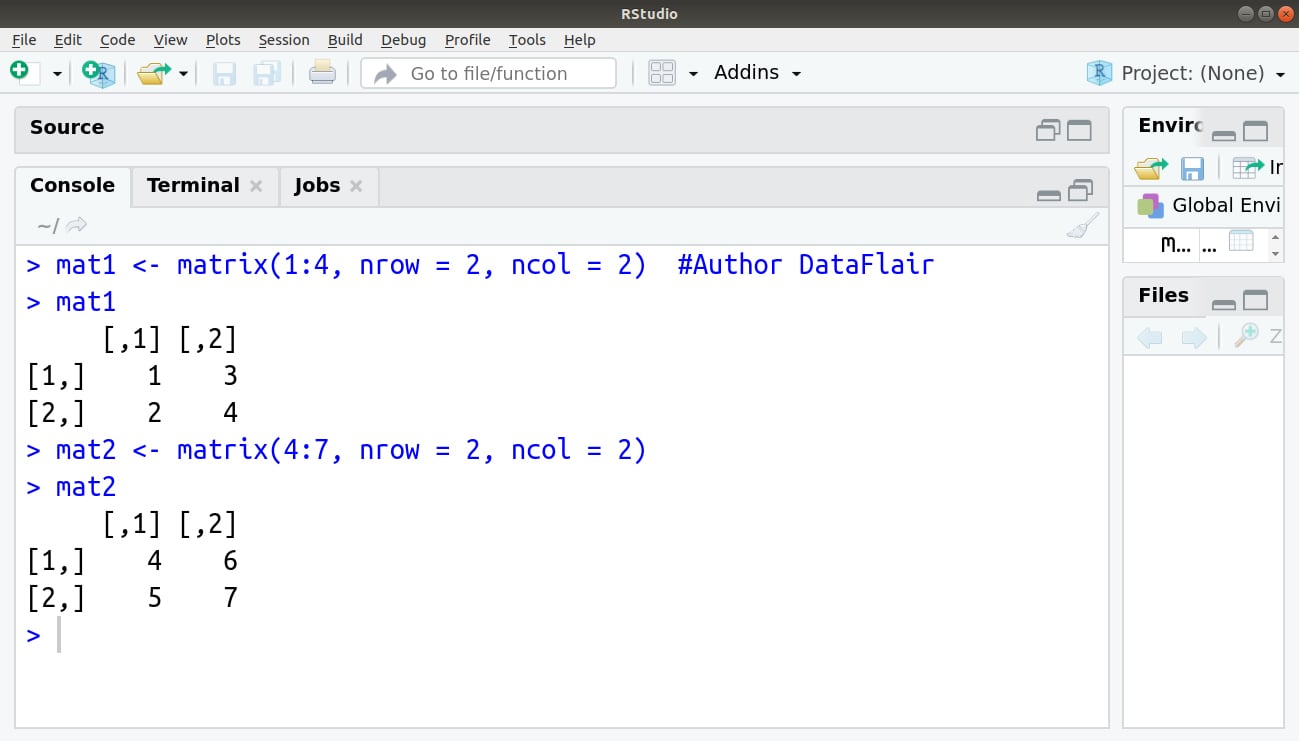
First of all, we will discuss what exactly matrices in data structures in R mean. A matrix is a two-dimensional rectangular data set and thus it can be created using vector input to the matrix function. In addition, a matrix is a collection of numbers arranged into a fixed number of rows and columns. Usually, the numbers are the real numbers. By using a matrix function, we can reproduce a memory representation of the matrix in R. Hence, the data elements must be of the same basic type.
> mat1 <- matrix(1:4, nrow = 2, ncol = 2)  #Author DataFlair
> mat1
> mat2 <- matrix(4:7, nrow = 2, ncol = 2)
> mat2
Output:
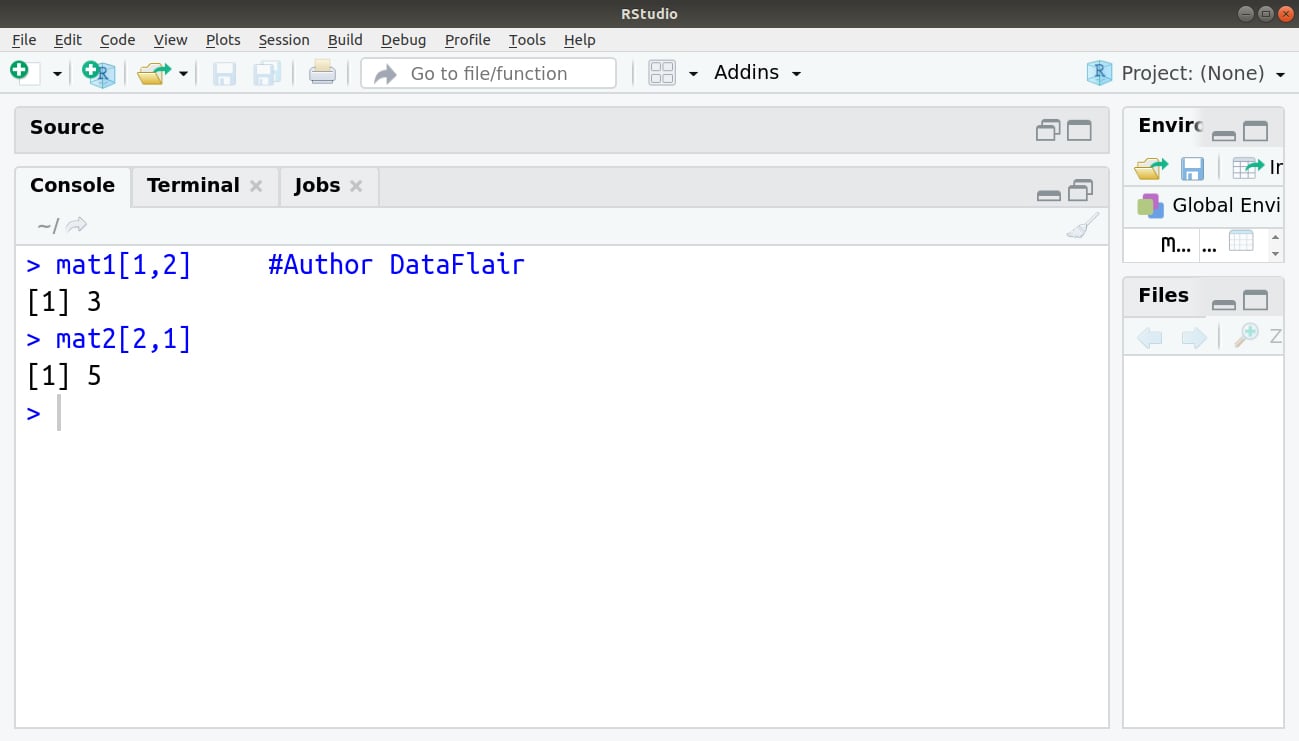
We can access the element present at the mth row and nth column as follows:
> mat1[1,2]     #Author DataFlair
> mat2[2,1]
Output:
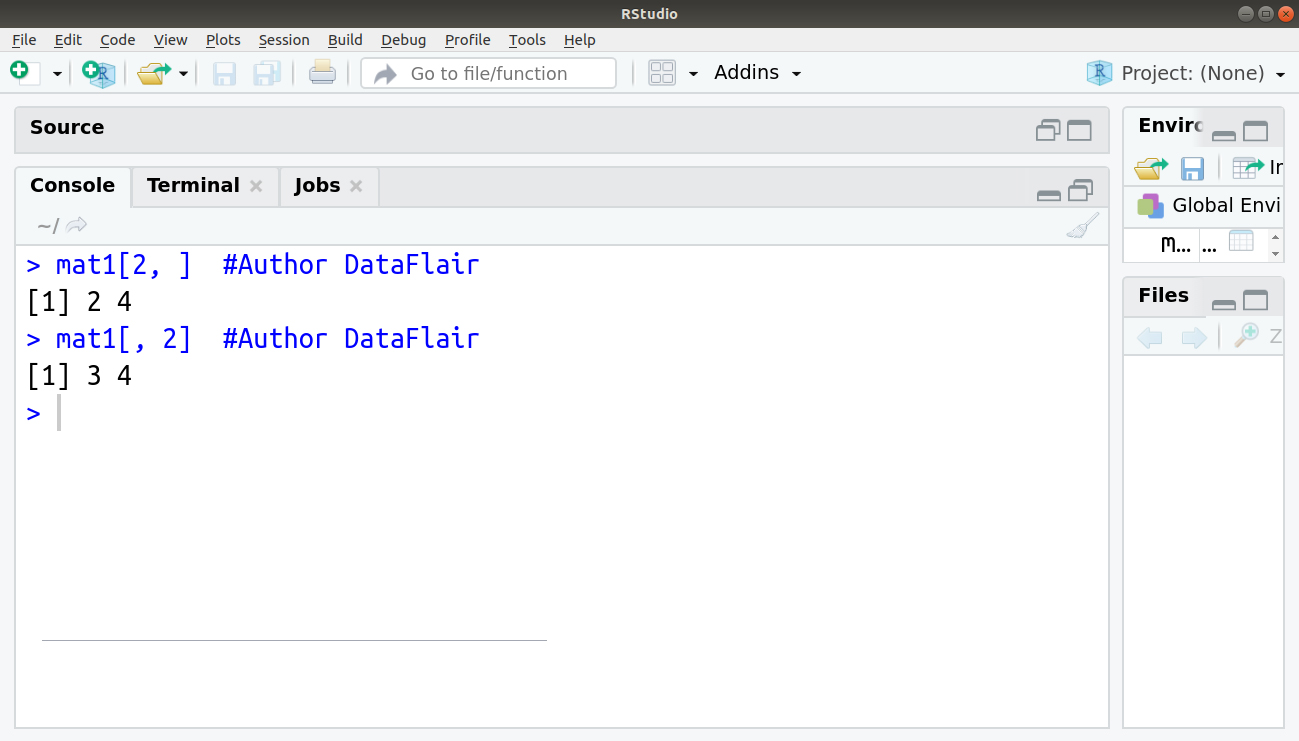
We can also extract the entire mth row and nth row separately as follows:
> mat1[2, ]  #Author DataFlair
> mat1[, 2]  #Author DataFlair
Output:
Before proceeding ahead, please confirm that you have completed – R Matrix Operations
Uses of Matrices
Method to solve the matrices:
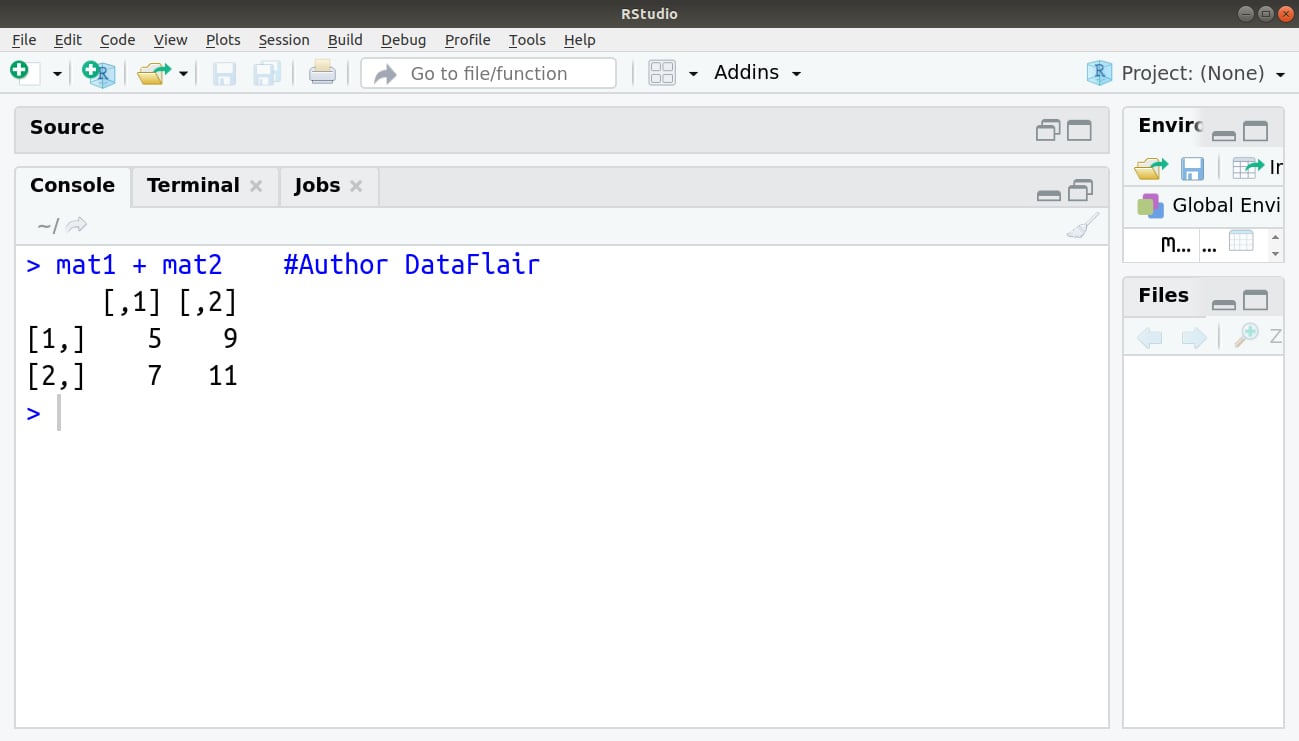
1. Adding
In addition of two matrices, we add the numbers in matching positions:
> mat1 + mat2 #Author DataFlair
Output:
2. Subtracting
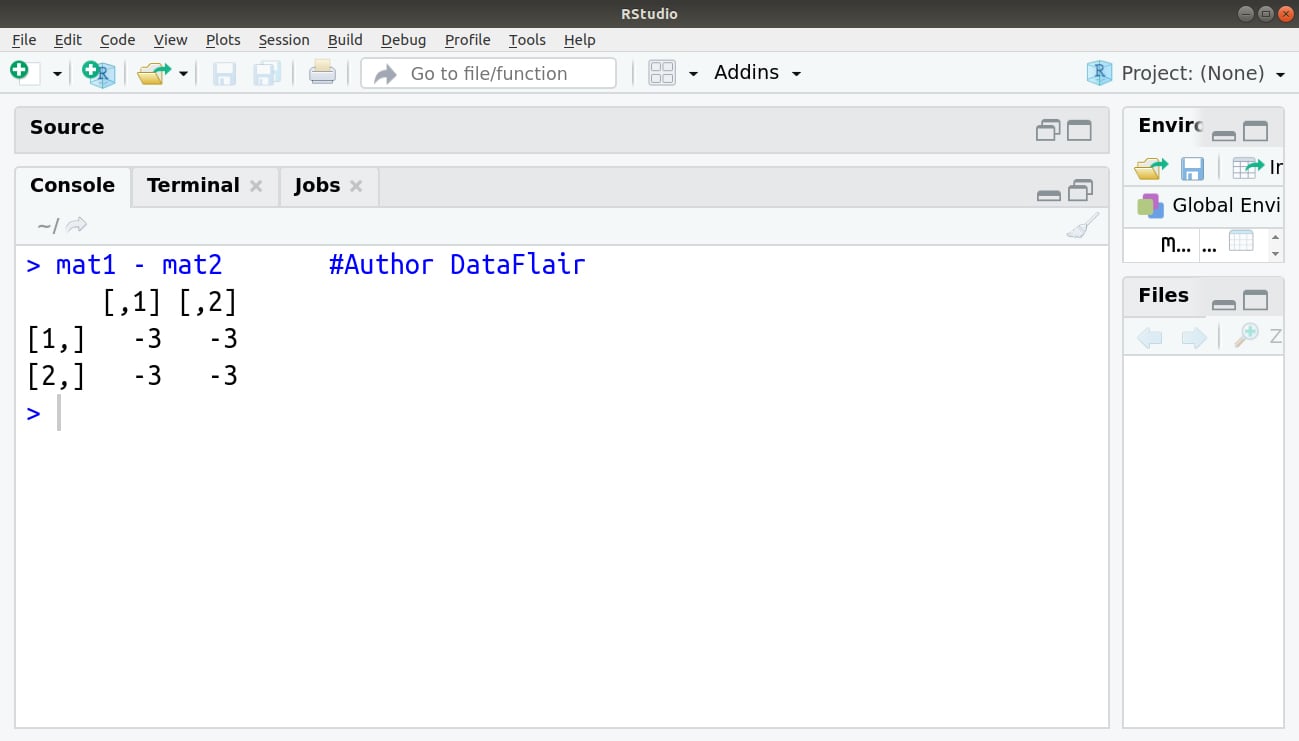
In subtraction of two matrices, we subtract the numbers in matching positions:
> mat1 - mat2 #Author DataFlair
Output:
3. Multiply by a constant
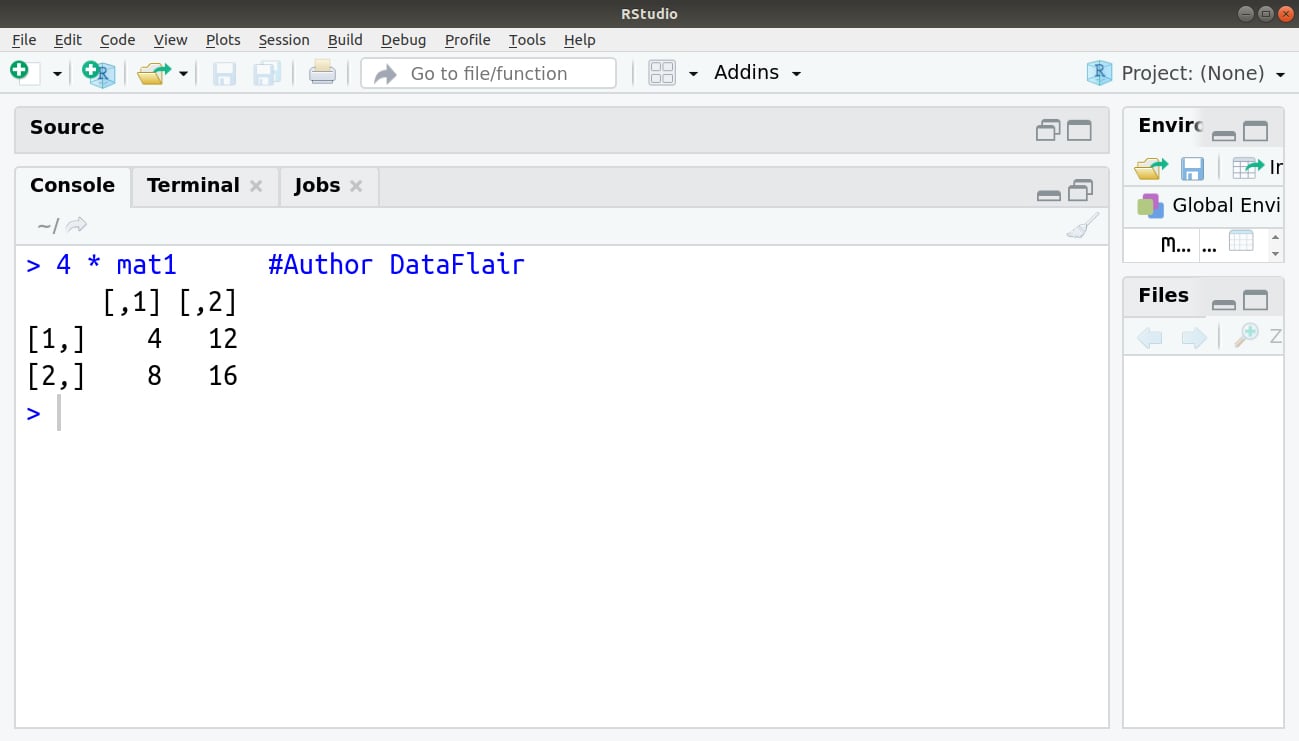
We can multiply by some constant value like so:
> 4 * mat1 #Author DataFlair
Output:
4. Dividing
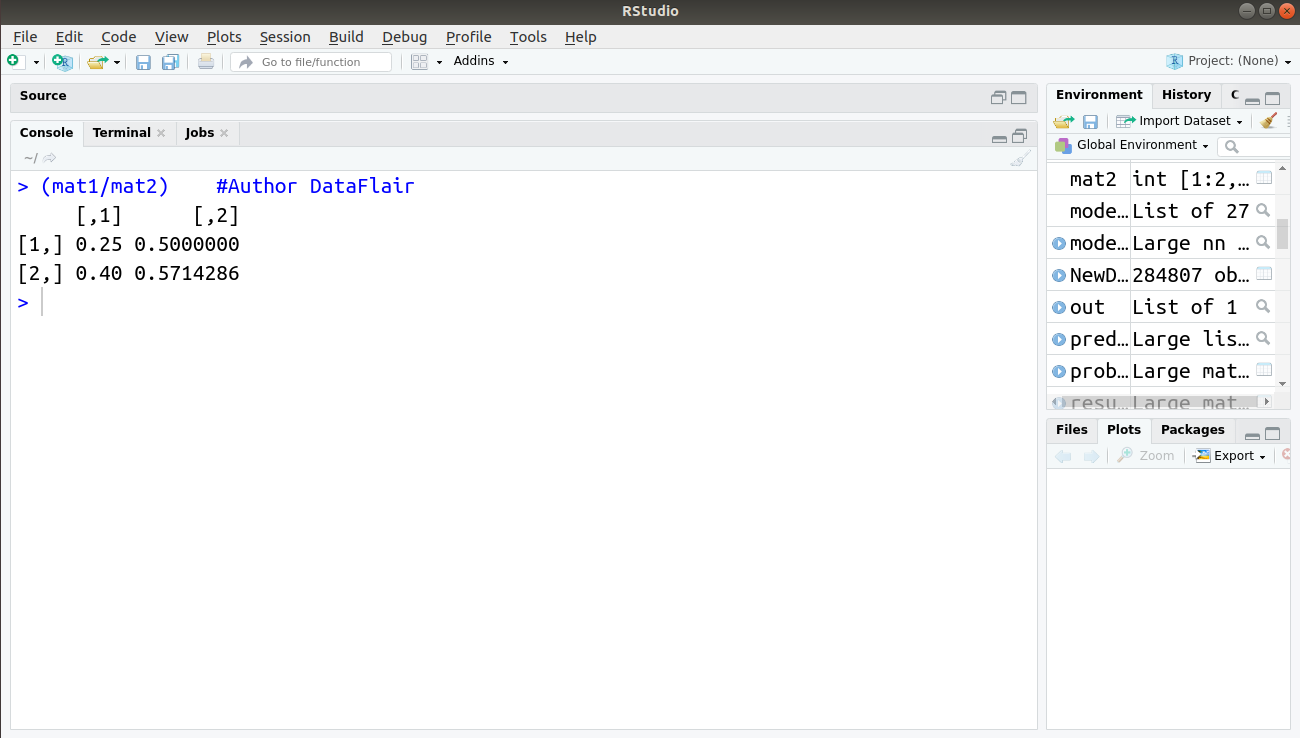
In division of two matrices, divides the numbers in matching positions
> (mat1/mat2) #Author DataFlair
Output:
5. Transposing
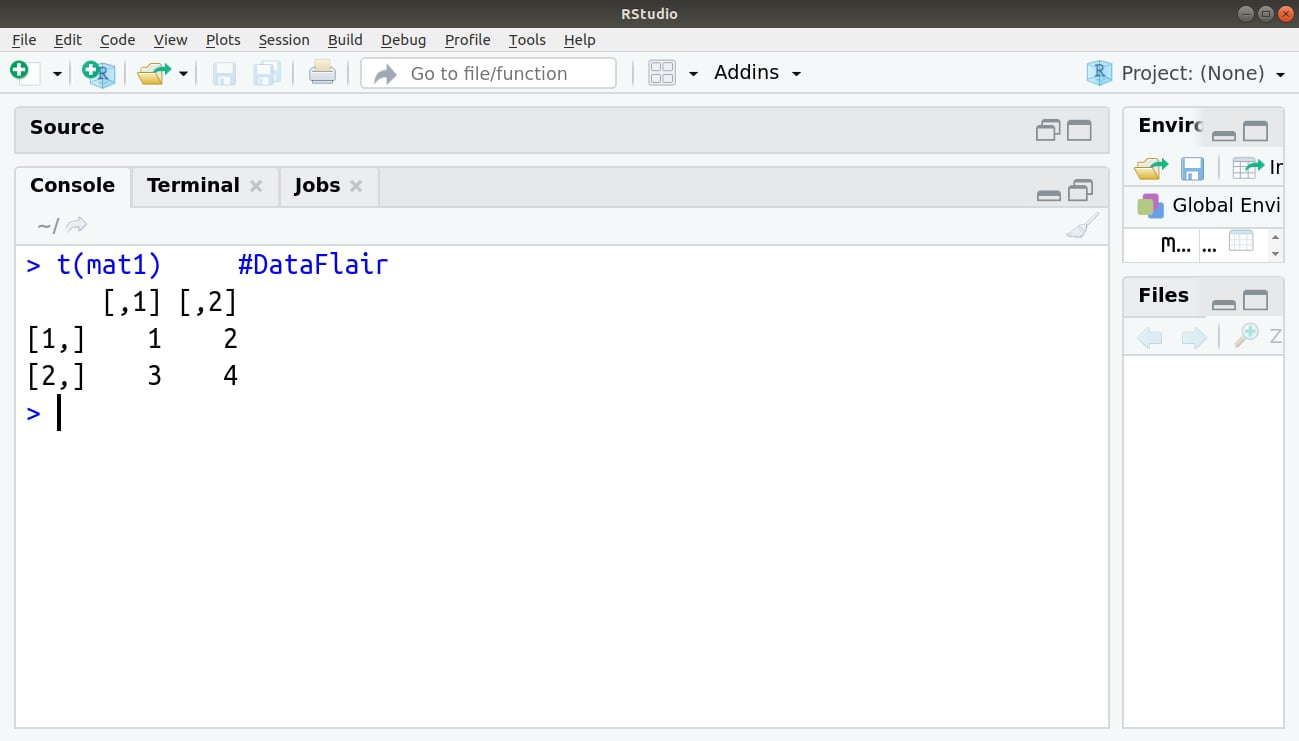
The transpose of a matrix is a matrix with the rows and columns swapped, we can find the transpose of a matrix with the t() function:
> t(mat1) #DataFlair
Output:
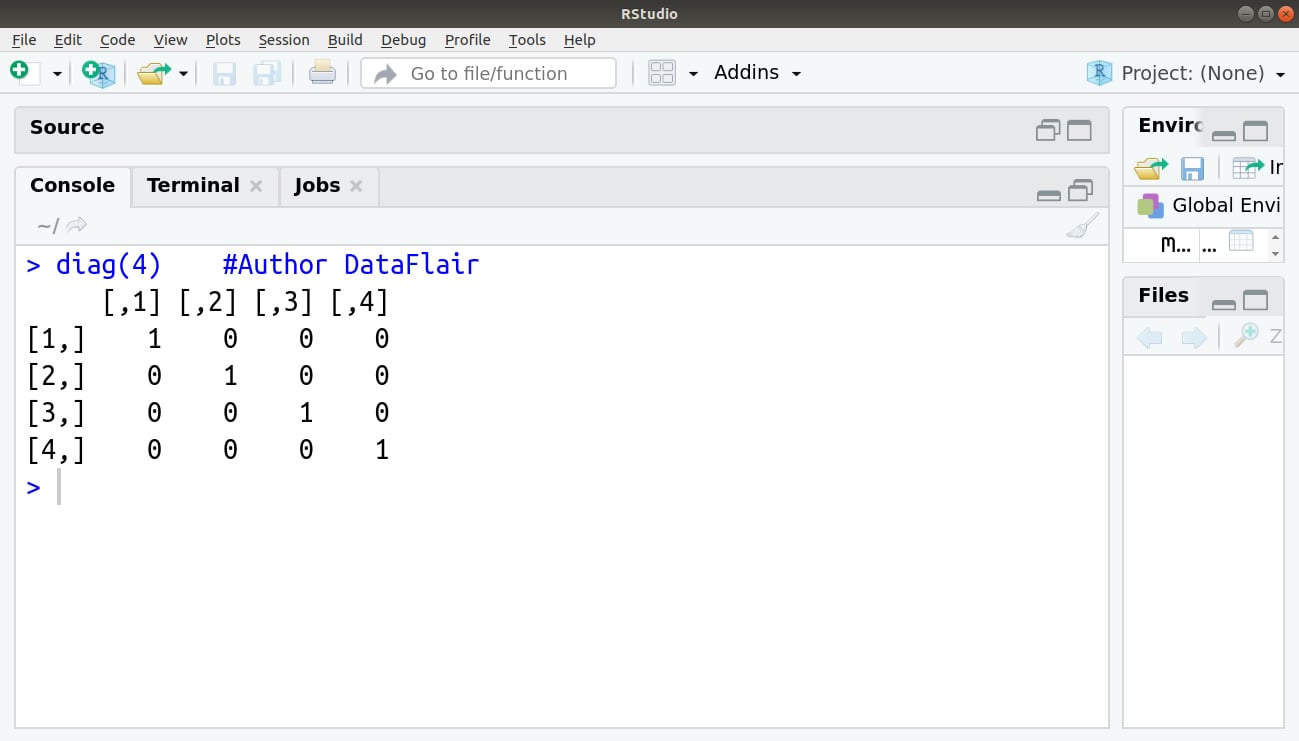
6. Identity Matrix
We can find the nxn identity matrix using the diag(n) function.
> diag(4) #Author DataFlair
Output:
A must learn concept to ease your R programming journey – R Factor Functions
Applications of Matrices
- Matrices are used for carrying out geological surveys. We can represent information in the form of matrices that can be used for plotting graphs, performing statistical operations, etc.
- To represent the real-world data is like traits of people’s population. They are the best representation method for plotting common survey things.
- In robotics and automation, matrices are the best elements for the robot movements.
- Matrices are used in calculating the gross domestic products in economics. Therefore, it helps in calculating goods product efficiency.
- In computer-based applications, matrices play a vital role in the projection of a three-dimensional image into a two-dimensional screen creating realistic seeming motions.
- In physical related applications, matrices can be applied in the study of an electrical circuit.
3. R Array
In R Programming, arrays are multi-dimensional Data structures. In an array, data is stored in the form of matrices, row, and as well as in columns. We can use the matrix level, row index, and column index to access the matrix elements.
Arrays in R are the data objects which can store data in more than two dimensions. An array is created using the array() function. We can use vectors as input. To create an array, we can use these values in the dim parameter.
For example:
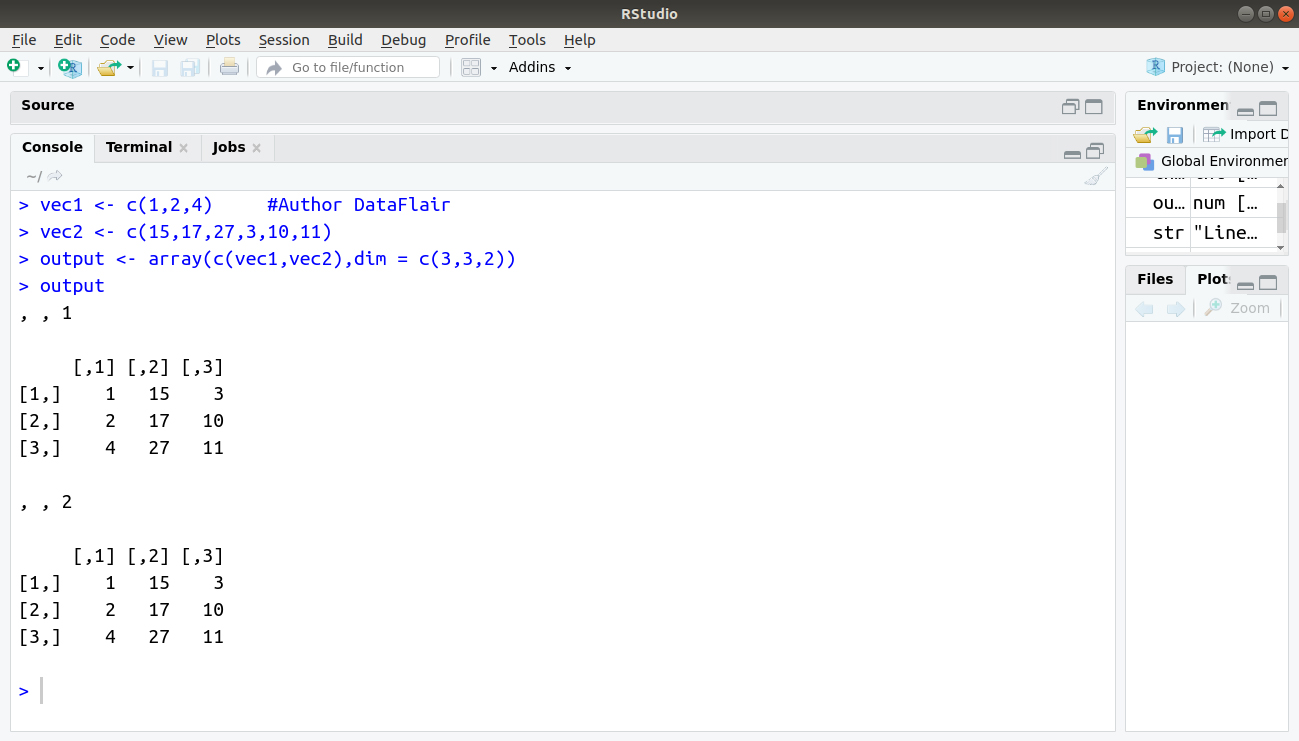
In this following example, we will create an array in R of two 3×3 matrices each with 3 rows and 3 columns.
# Create two vectors of different lengths.
> vec1 <- c(1,2,4)     #Author DataFlair
> vec2 <- c(15,17,27,3,10,11)
> output <- array(c(vec1,vec2),dim = c(3,3,2))
> output
Output:
Different Operations on Rows and Columns
1. Naming Columns And Rows
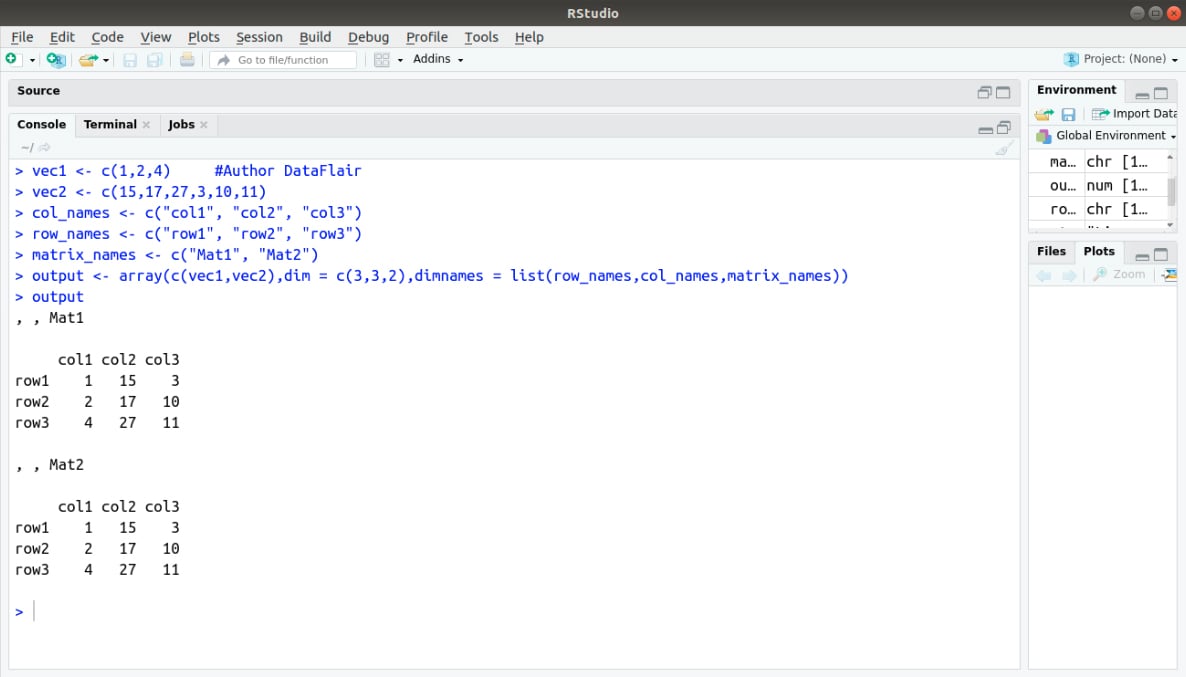
We can give names to the rows, columns, and matrices in the array by using the dimnames parameter.
# Create two vectors of different lengths.
vec1 <- c(1,2,4)
vec2 <- c(15,17,27,3,10,11)
column_names <- c(“col1″,”col2″,”col3”)
row_names <- c(“row1″,”row2″,”row3”)
matrix_names <- c(“Mat1″,”Mat2”)
# Take these vectors as input to the array.
output <- array(c(vec1,vec2),dim = c(3,3,2),dimnames = list(row_names,column_names,
matrix_names))
output
Output:
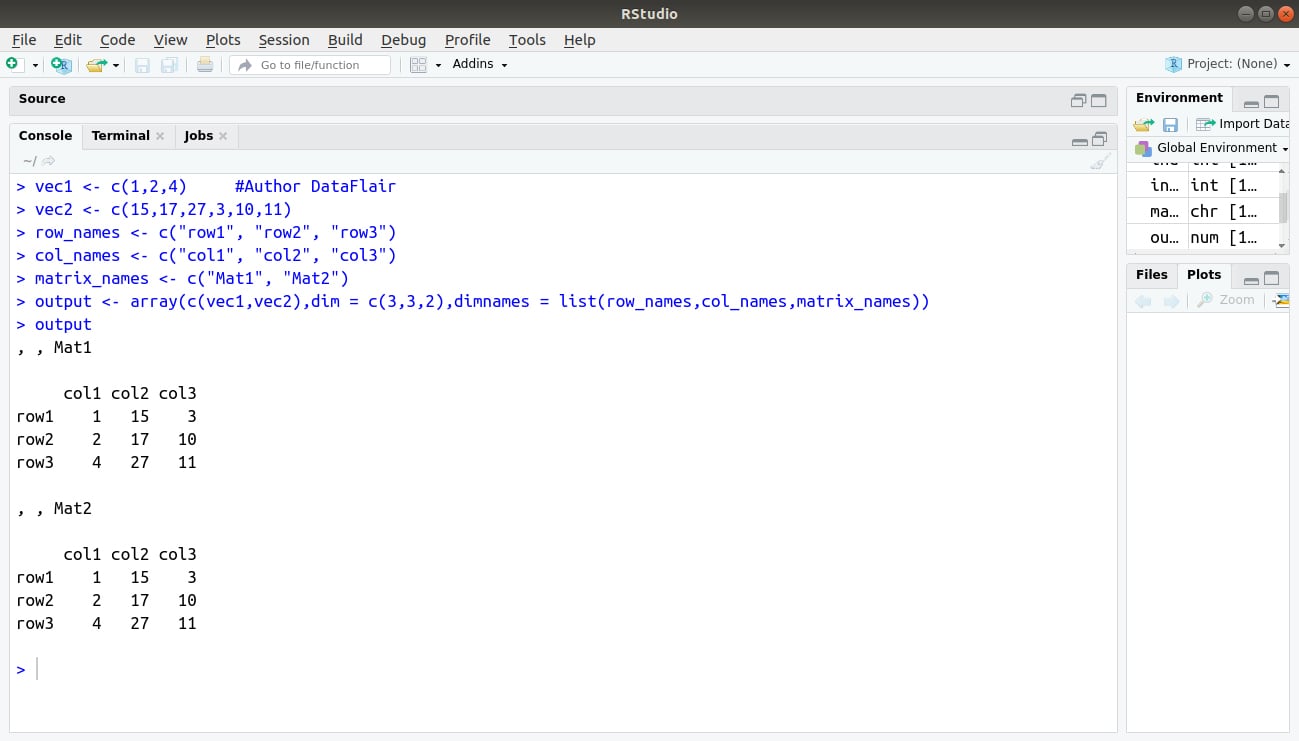
2. Accessing Array Elements
# We will create two vectors of different lengths.
vec1 <- c(1,2,4)
vec2 <- c(15,17,27,3,10,11)
row_names <- c(“row1″,”row2″,”row3”)
col_names <- c(“col1″,”col2″,”col3”)
matrix_names <- c(“Mat1″,”Mat2”)
output <- array(c(vec1,vec2),dim = c(3,3,2),dimnames = list(row_names,col_names,matrix_names))
output
Output:
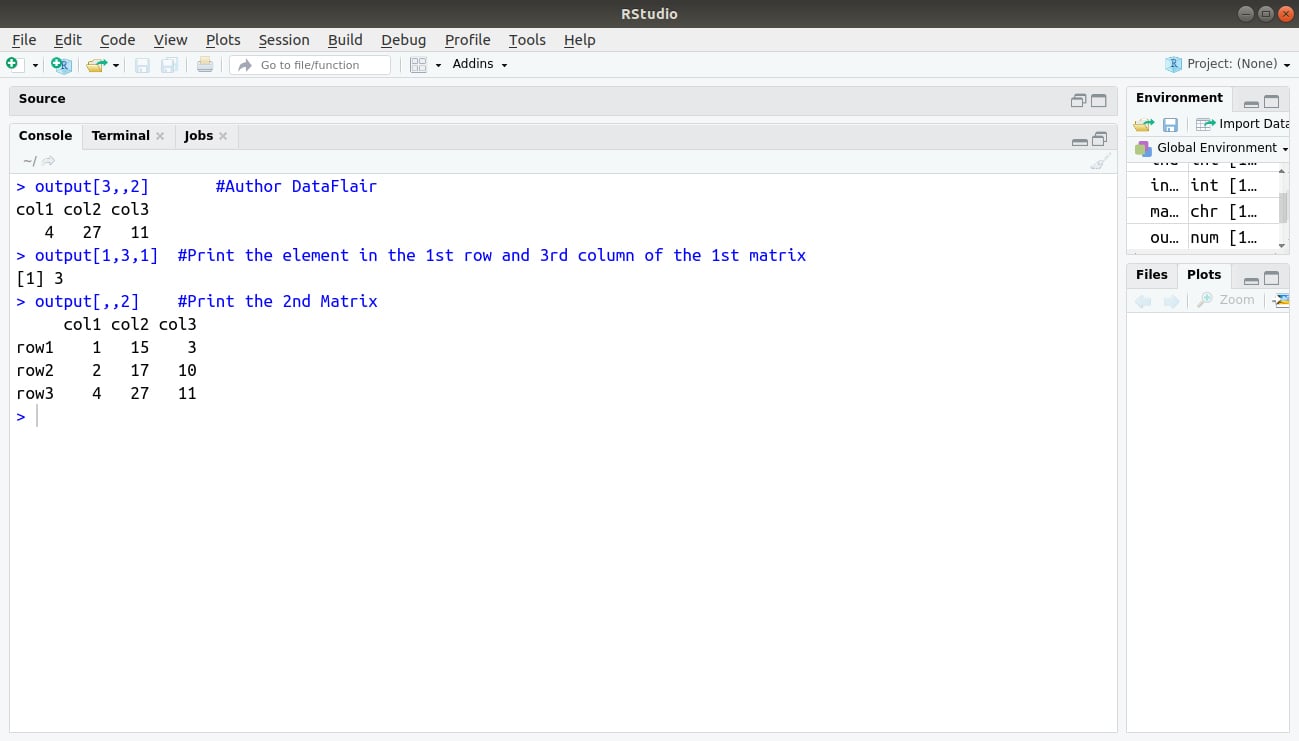
> output[3,,2] #Author DataFlair
> output[1,3,1] #Print the element in the 1st row and 3rd column of the 1st matrix
> output[,,2] #Print the 2nd Matrix
Output:
3. Manipulating Array Elements
As the array is made up of matrices in multiple dimensions, the operations on elements of an array are carried out by accessing elements of the matrices.
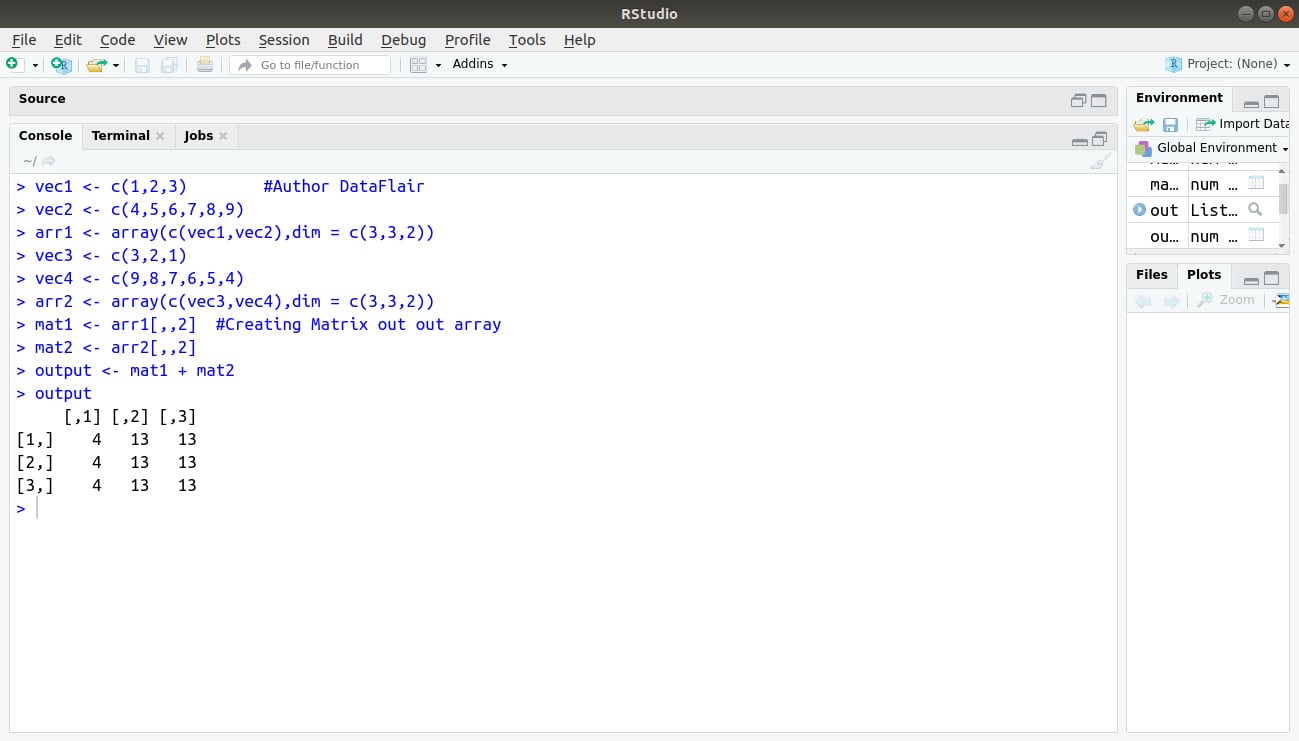
> vec1 <- c(1,2,3)        #Author DataFlair
> vec2 <- c(4,5,6,7,8,9)
> arr1 <- array(c(vec1,vec2),dim = c(3,3,2))
> vec3 <- c(3,2,1)
> vec4 <- c(9,8,7,6,5,4)
> arr2 <- array(c(vec3,vec4),dim = c(3,3,2))
> mat1 <- arr1[,,2]  #Creating Matrix out out array
> mat2 <- arr2[,,2]
> output <- mat1 + mat2
> output
Output:
4. Calculations across R Array Elements
We will be using the apply() function for calculations in an array in R.
Syntax:
apply(x, margin, fun)
Following is the description of the parameters used:
- x is an array.
- A margin is the name of the dataset used.
- fun is the function to be applied to the elements of the array.
For example:
We use the apply() function below in different ways to calculate the sum of the elements in the rows of an array across all the matrices.
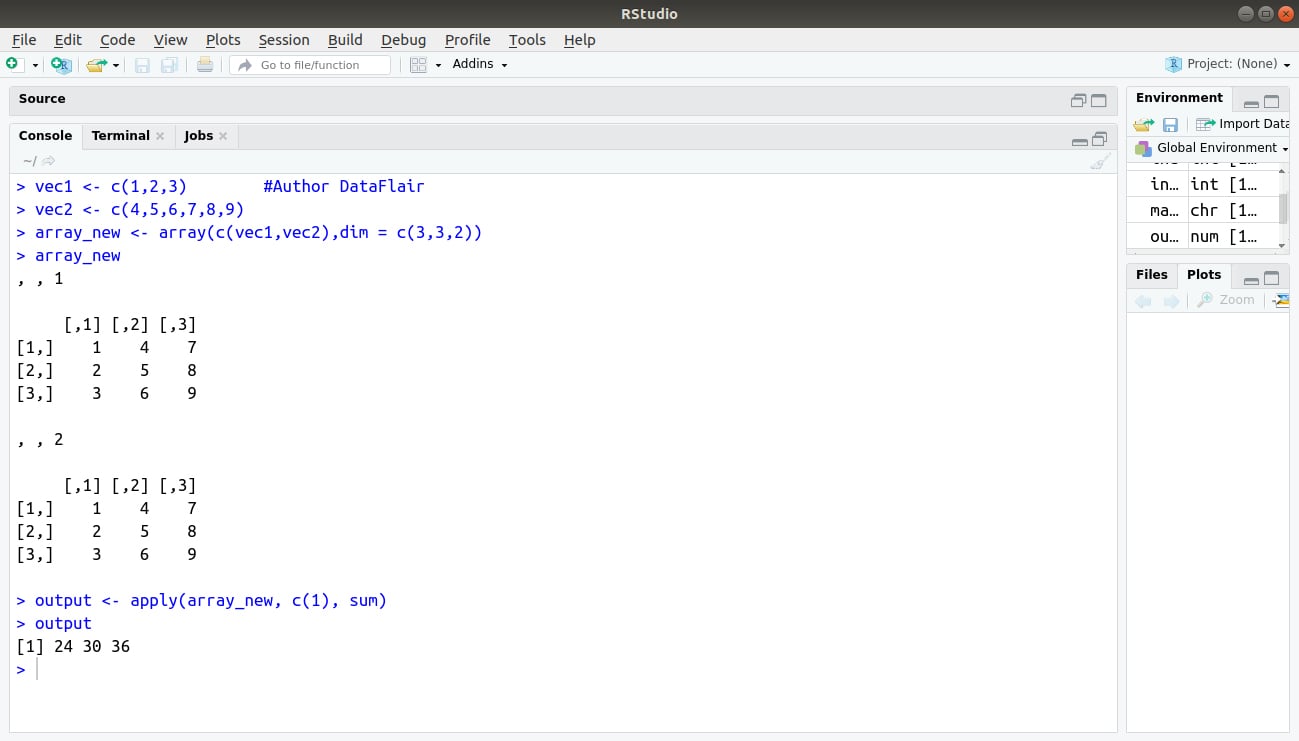
> vec1 <- c(1,2,3)        #Author DataFlair
> vec2 <- c(4,5,6,7,8,9)
> array_new <- array(c(vec1,vec2),dim = c(3,3,2))
> array_new

> output <- apply(array_new, c(1), sum)
> output
Output:
Explore a complete tutorial on R Array Function
4. List in R
Lists are the objects which contain elements of different types – like strings, numbers, vectors and another list inside them. A list can also contain a matrix or a function as its elements. In other words, a list is a generic vector containing other objects. A list is created using the list() function.
For example:
The variable x is containing copies of three vectors n, s, b and a numeric value 3.
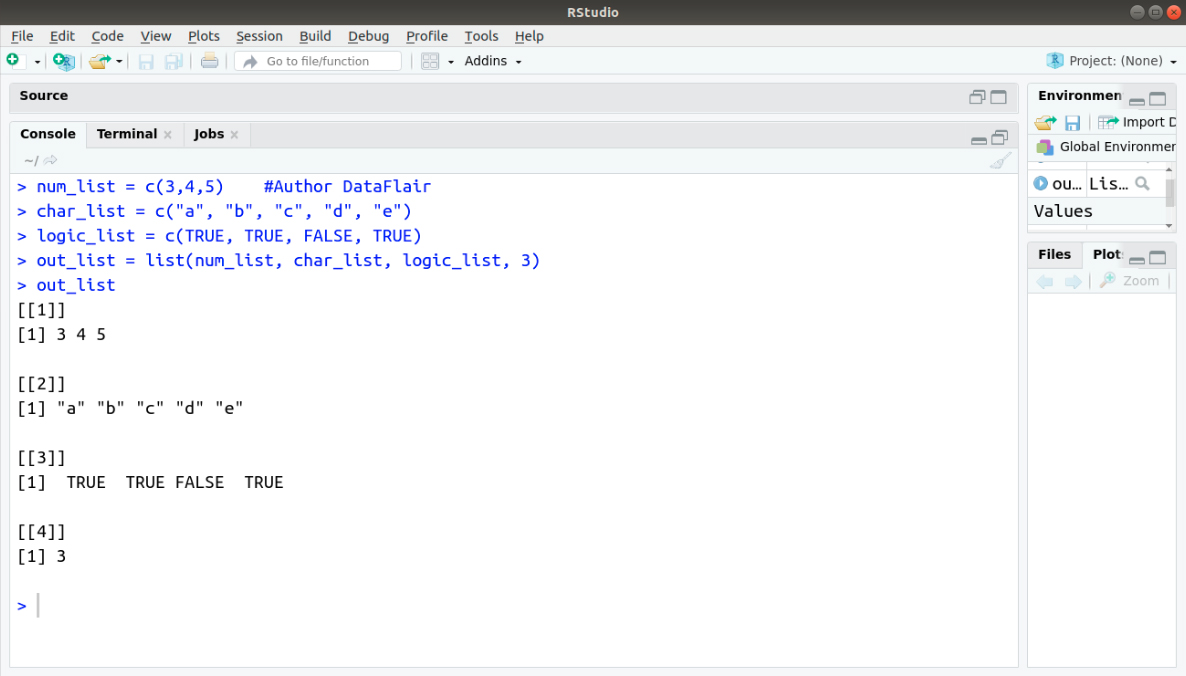
> num_list = c(3,4,5)    #Author DataFlair
> char_list = c("a", "b", "c", "d", "e")
> logic_list = c(TRUE, TRUE, FALSE, TRUE)
> out_list = list(num_list, char_list, logic_list, 3)
> out_list
Output:
5. Data Frame in R
First of all, we are going to discuss where the concept of data frame came. The concept comes from the world of the statistical software used in empirical research. It generally refers to tabular data: a data structure representing the cases (rows), each of which consists of numbers of observation or measurement (columns).
A data frame is used for storing data tables. It is a list of vectors of equal length.
For example:
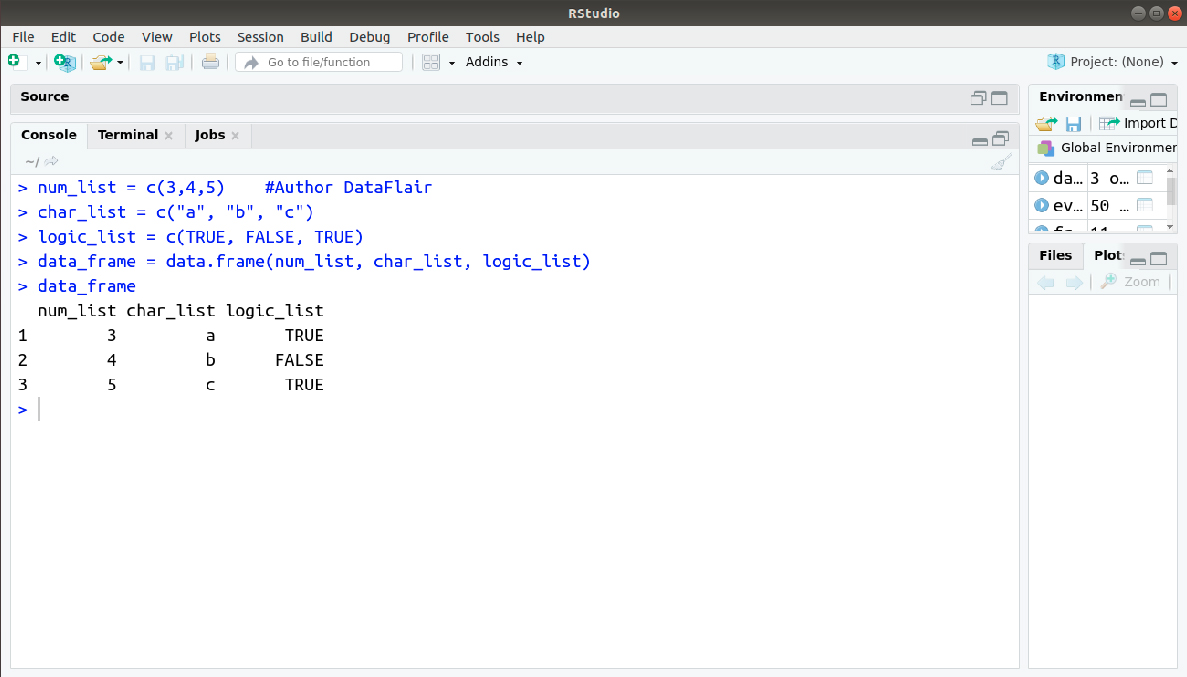
The following variable df is a data frame containing three variables n, s, b.
> num_list = c(3,4,5)    #Author DataFlair
> char_list = c("a", "b", "c")
> logic_list = c(TRUE, FALSE, TRUE)
> data_frame = data.frame(num_list, char_list, logic_list)
> data_frame
Output:
A data frame is an array. Unlike an array, the data we store in the columns of the data frame can be of various types. That is, one column might be a numeric variable, another might be a factor, and a third might be a character variable. All columns have to be of the same length.
Characteristics of a Data Frame:
- The column names should be non-empty.
- The row names should be unique.
- The data stored in a data frame can be of numeric, factor or character type.
- Each column should contain the same number of data items.
Datasets imported in R are stored as data frames by default.
Get to know everything about R Data Frame Concept in detail
Summary
We learned about all the types of data structures in R Programming along with their use, implementation, and examples. We hope you understood every concept thoroughly.
Still, if you have any doubts related to any of the topics, feel free to share in the comment section below.
Did you like this article? If Yes, please give DataFlair 5 Stars on Google


The answer of the matrix(execution code is wrong). It should be (20,26,32) instead of (26,26,35). Correct it in case if anyone is new too it.
Hey Shivangi,
Thanks for pointing our typo. We have made the necessary changes. From now, you can learn Data structure in R programming freely.
Keep visiting and keep learning