Data Science for Beginners – Understand it Easily with Real-life Use Cases
Free Machine Learning courses with 130+ real-time projects Start Now!!
Data Science is a field that deals with a lot of complicated stuff. The complications associated with Data Science often pose hurdles to beginners who wish to understand it in simple words. In this blog, we will introduce Data Science for beginners in simple words.
Keeping aside the complexities associated with Data Science, we will walk you through the detailed concepts of Data Science, this means we will learn Data Science from scratch so that any beginner could understand the concept easily.
1. What is Data Science?
Almost everyone seems to talk about Data Science. Very few people have an idea about the actual role of a Data Scientist or the meaning behind the term itself.
Data Science a combination of multiple disciplines that uses algorithms and scientific processes to extract knowledge out of data and create insights about it. We will help you to understand Data Science through several anecdotes.
This will enable you to realize the key principles of Data Science without dwelling on complex jargons. With this, let us start with our first introduction to Data Science for beginners.
You Must Explore 13 Essential Data Science Books
2. Data Science for Beginners – Real-life Analogies
i. What Sells Most Ice-Creams?
We understand patterns using Data Science. The ultimate goal of a Data Scientist is to design algorithms and use statistical tools to understand and recognize patterns. Through patterns, we are able to find instances which ‘correlate’ to one another.
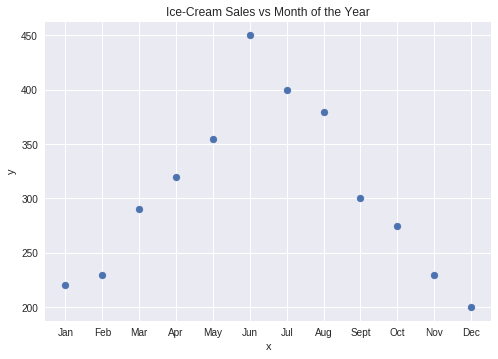
We will understand correlation through the following example. Consider an ice-cream truck selling ice-cream on several days of the year. The ice-cream seller notes down the number of sales in a month. He makes the following observations:
Month | Ice-Cream Sales |
| January | $220 |
| February | $230 |
| March | $290 |
| April | $320 |
| May | $355 |
| June | $450 |
| July | $400 |
| August | $380 |
| September | $300 |
| October | $275 |
| November | $230 |
| December | $200 |
In the above instance, Months are independent variable – x and Sales are dependent variable – y. This is because the number of sales are dependent on the month of the year. We present the above observations visually using the following graph:
Do you know the future of Data Science?
From the above observations, we infer that the sales were highest during the hottest months and lowest in cold months of the year. Therefore, we understand that there is a ‘pattern’ of ice-cream sales. We call the pattern in this case as ‘correlation’ in the terms of Data Science.
Therefore, we say that there is a strong correlation between ice-cream sales and month of the year. Now, using this data, a Data Scientist can develop a model to predict the number of sales of ice-cream for the next year.
The ice-cream seller, would, therefore, be able to know more about his business and take decisions to boost his sales.
ii. Learning to Speak
Imagine yourself in the footsteps of a baby who barely speaks a word of the language. He follows his parents closely, immersing himself in the language they speak, understanding the pattern of sounds and gradually starts mimicking it.
He recognizes the way certain sounds are always following each other and starts to recognize a pattern. It is this pattern that makes the child gradually understand human language. Data Science is all about finding patterns.
In fact, we train machines to understand human language by finding similar patterns in speech. Data Scientists design algorithms to recognize patterns in human speech.
iii. Recognizing Defects
Now, place yourself near the conveyor belt of a cereal packaging industry. You have to recognize the defected packaging of cereals and remove them from the conveyor belt. Having an idea of what a perfect packaging would look like, you scan through all the cereal boxes.
When a defective packet comes along on the conveyor belt, you recognize it and prevent it from reaching the group of other packages. In this instance as well, you recognized the pattern of regular cereal boxes and filtered the ones which do not fit the pattern.
Recommended Reading – Skills required for becoming a Data Scientist
iv. Using Suggestions to Make Better Decisions
Let us take another example to understand the pattern principle of Data Science. Assume that you go to a shop to purchase clothes for yourself. After going through several styles of clothing, you find something that appeals to you.
The shopkeeper has the experience of identifying styles of clothing shows you other similar types of cloth wear. In this case, the shopkeeper recognizes the pattern of your preferences and gives you recommendations.
We use the concept of giving recommendations in e-commerce websites to help you to navigate through similar products that you had purchased in the past. The recommendation engine uses Data Science to help you find products that appeal to you the most.
3. How Data Scientists Make Data Meaningful
From the above examples, we understand that a Data Scientist must find patterns within the data. But before he can find patterns, a Data Scientist must organize the data in a standard format.
This organization of Data involves data transformation, cleaning the data, checking for missing values and ‘normalizing’ the data. In this Data Science for Beginners tutorial, we will go through each of the steps in brief.
Data Extraction
Often the data extracted by the Data Scientist is in unorganized format. Remember the ice-cream sales observation table from the first example? The data in that instance was neatly organized into two columns of month and sales.
We were able to analyze and infer from that observation table quite easily. However, most of the times, the Data Scientist does not have organized data. Therefore, he must transform the data in a standardized format so that he can analyze and draw inferences without any hassle.
Data Cleaning
The next step that a Data Scientist must perform is data cleaning. It involves the removal of erroneous values from the given data. In a given data, there can be a presence of certain values that do not make sense.
These values can inhibit a Data Scientist from performing his operations. Therefore, he must clean the data before understanding the patterns within it.
Replacing the Missing Values
Now, consider the first instance of ice-cream sales observation table again. Suppose that there was some value missing from the table, say, there was no data for a number of sales in the month of August for one particular year.
In order to fully analyze the data in detail, a Data Scientist must be able to check for missing values and replace them with a suitable value.
If there is an abundance of data regarding ice-cream sales of the past five years, then the Data Scientist can find the average sales in August for previous years and replace the missing value with this average.
Say, we do not have the number of sales in August for the year 2019. But the number of sales in August for the years 2013-2018 are – $382, $379, $380, $384, $381. The average of these values is 381.20. Therefore, we assume that the number of sales in August 2019 is $381.20
Learn How to Become a Data Scientist by Infographic
Normalization
After replacing the missing values, we ‘normalize‘ the data. By normalize or normalization, we mean to scale our values in a standard range. We perform this so that the magnitude of values do not have any effect on the model.
For example, 2000 mg is much smaller than 20 kg. However, the magnitude in number for 2000 is much more than 20. Therefore, there is a need for scaling to transform these values in a practical range.
Tools that Data Scientists Use
In order to perform all these tasks, a Data Scientist uses many tools. Some of them are – R, Python, Scala, SQL, and SAS. Using Data Science, companies are able to make powerful data-driven decisions. Data has become the fuel for many industries.
This has resulted in a huge demand for Data Scientists. The field of Data Science requires one to have expertise in various backgrounds like Statistics, Programming, and Mathematics.
Considering the abundance of Data Science positions and a dearth of Data Scientists, there is very less saturation compared to other IT sectors. Being very versatile in nature, Data Science has rooted itself in the healthcare industry, banking, consultancy, and manufacturing industries.
So, this was all in Data Science for Beginners. Hope you liked our explanation.
4. Summary – Data Science for Beginners
Hence, in this Data Science for Beginners tutorial, we saw several examples to understand the true meaning of Data Science and the role of a Data Scientist. We conclude that Data Science is about finding patterns in Data through thorough analysis.
While finding meaningful insights and patterns is always the end goal of a Data Scientist, it requires extensive Data Preprocessing and other important procedures.
In the end, it is in the hands of a Data Scientist to help companies make data-driven decisions and make their business better. Still, if any doubt, ask in the comment section.
Your opinion matters
Please write your valuable feedback about DataFlair on Google

