Inside a Data Scientist’s ToolBox: Top 9 Data Science Algorithms
Free Machine Learning courses with 130+ real-time projects Start Now!!
In a Data Science interview, the interviewer asked me, how would you explain top data science algorithms to a non-tech person. I told him that Data science is…..(read the article to know :D).
The explanation is too simple that you can easily understand. We will discuss mostly machine learning algorithms that are important for data scientists and classify them based on supervised and unsupervised roles.
I will provide you an outline of all the important algorithms that you can deploy for improving your data science operations.
Top Data Science Algorithms
Here is the list of top Data Science Algorithms that you must know to become a data scientist. Let’s start with the first one –
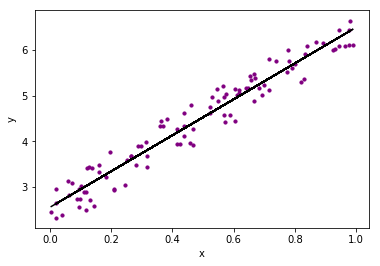
1. Linear Regression
Linear Regression is a method of measuring the relationship between two continuous variables. The two variables are –
- Independent Variable – “x”
- Dependent Variable – “y”
In the case of a simple linear regression, the independent value is the predictor value and it is only one. The relationship between x and y can be described as:
y = mx + c
Where m is the slope and c is the intercept.
Based on the predicted output and the actual output, we perform the calculation
Don’t forget to check the important Data Science Skills
2. Logistic Regression
Logistic Regression is used for binary classification of data-points. It performs categorical classification that results in the output belonging to either of the two classes (1 or 0). For example, predicting whether it would rain or not, based on the weather condition is an example of logistic regression.
The two important parts of Logistic Regression are Hypothesis and the Sigmoid Curve. Using this hypothesis, we derive the likelihood of an event.
The data that is produced from our hypothesis is fit into the log function that ultimately forms an S shaped curve called ‘sigmoid’. Based on this log function, we are able to determine the category of the class.
The sigmoid is an S-shaped curve that is represented as follows:
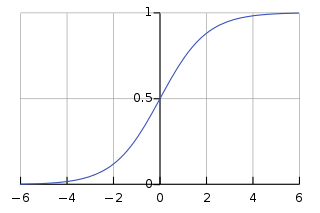
We generate this with the help of logistic function –
1 / (1 + e^-x)
Here, e represents base of natural log and we obtain the S-shaped curve with values between 0 and 1. The equation for logistic regression is written as:
y = e^(b0 + b1*x) / (1 + e^(b0 + b1*x))
Here, b0 and b1 are the coefficients of the input x. These coefficients are estimated using the data through “maximum likelihood estimation”.
Have you checked Top Programming Languages that are must for a Data Scientist?
3. K-Means Clustering
According to the formal definition of K-means clustering – K-means clustering is an iterative algorithm that partitions a group of data containing n values into k subgroups. Each of the n value belongs to the k cluster with the nearest mean.
This means that given a group of objects, we partition that group into several sub-groups. These sub-groups are formed on the basis of their similarity and the distance of each data-point in the sub-group with the mean of their centroid.
K-means clustering is the most popular form of an unsupervised learning algorithm. It is easy to understand and implement.
The objective of the K-means clustering is to minimize the Euclidean distance that each point has from the centroid of the cluster. This is known as intra-cluster variance and can be minimized using the following squared error function –
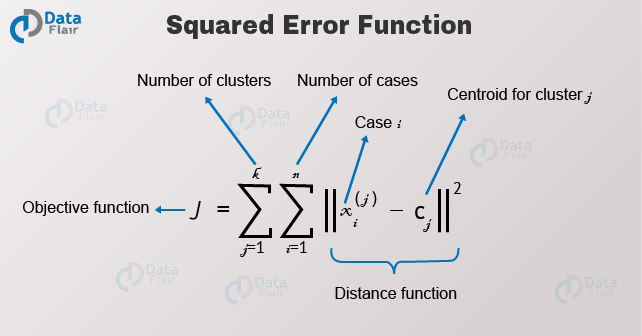
Where J is the objective function of the centroid of the cluster. K are the number of clusters and n are the number of cases. C is the number of centroids and j is the number of clusters.
X is the given data-point from which we have to determine the Euclidean Distance to the centroid. Let us have a look at the algorithm for K-means clustering –
- First, we randomly initialize and select the k-points. These k-points are the means.
- We use the Euclidean distance to find data-points that are closest to their centreW of the cluster.
- Then we calculate the mean of all the points in the cluster which is finding their centroid.
- We iteratively repeat step 1, 2 and 3 until all the points are assigned to their respective clusters.

K-means Clustering – A detailed guide for you.
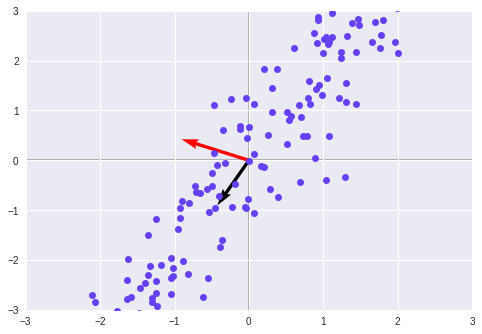
4. Principal Component Analysis
One of the most important part of data science is dimension. There are several dimensions in data. The dimensions are represented as n.
For example, suppose that as a data scientist working in a financial company, you have to deal with customer data that involves their credit-score, personal details, salary and hundreds of other parameters.
In order to understand the significant labels that contribute towards our model, we use dimensionality reduction. PCA is a type of reduction algorithm.
With the help of PCA, we can reduce the number of dimensions while keeping all the important ones in our model. There are PCAs based on the number of dimension and each one is perpendicular to the other (or orthogonal). The dot product of all the orthogonal PCs is 0.
5. Support Vector Machines
Support Vector machines are powerful classifiers for classification of binary data. They are also used in facial recognition and genetic classification. SVMs have pre-built regularization model that allows data scientists to SVMs automatically minimize the classification error.
It, therefore, helps to increase the geometrical margin which is an essential part of an SVM classifier.
Don’t forget to check the real-life applications of SVM
Support Vector Machines can map the input vectors to n-dimensional space. They do so by building a maximum separation hyperplane. SVM’s are formed by structure risk minimization.
There also two other hyperplanes, on either side of the initially constructed hyperplane. We measure the distance from the central hyperplane to the other two hyperplanes.
6. Artificial Neural Networks
Neural Networks are modeled after the neurons in the human brain. It comprises many layers of neurons that are structured to transmit information from the input layer to the output layer. Between the input and the output layer, there are hidden layers present.
These hidden layers can be many or just one. A simple neural network comprising of a single hidden layer is known as Perceptron.
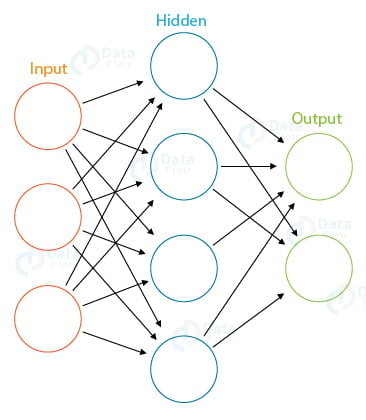
In the above diagram for a simple neural network, there is an input layer that takes the input in the form of a vector. Then, this input is passed to the hidden layer which comprises of various mathematical functions that perform computation on the given input.
For example, given the images of cats and dogs, our hidden layers perform various mathematical operations to find the maximum probability of the class our input image falls in. This is an example of binary classification where the class, that is, dog or cat, is assigned its appropriate place.
Recommended Reading – R for Data Science
7. Decision Trees
With the help of decision trees, you can perform both prediction and classification. We use Decision Trees to make decisions with a given set of input. Understand decision tree with the help of the following example:
Suppose you go to the market to buy a product. First, you assess if you really need the product, that is, you will go to the market only if you do not have the product. After assessing it, you will determine if it is raining or not.
Only if the sky is clear, you will go to the market, otherwise, you will not go. We can observe this in the form of a decision tree-
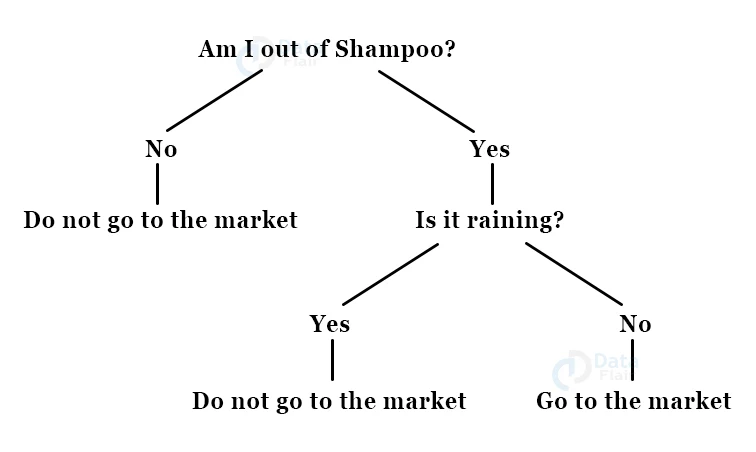
Using the same principle, we build a hierarchical tree to reach a result through a process of decisions. There are two steps to building a tree: Induction & Pruning. Induction is the process in which we build the tree, whereas, in pruning, we simplify the tree by removing complexities.
8. Recurrent Neural Networks
Recurrent Neural Networks are used for learning sequential information. These sequential problems consist of cycles that make use of the underlying time-steps. In order to compute this data, ANNs require a separate memory cell in order to store the data of the previous step.
We use data that is represented in a series of time-steps. This makes RNN an ideal algorithm for solving problems related to text processing.
In the context of text-processing, RNNs are useful for predicting future sequences of words. RNNs that are stacked altogether are referred to as Deep Recurrent Neural Networks. RNNs are used in generating text, composing music and for time-series forecasting.
Chatbots, recommendation systems and speech recognition systems use varying architectures of Recurrent Neural Networks.
Have a look at NLP tutorial for Data Science
9. Apriori
In 1994, R. Agrawal and R. Srikant developed the Apriori Algorithm. This algorithm is used for finding frequently occurring itemsets using the boolean association rule. This algorithm is called Apriori as it makes use of the ‘prior’ knowledge of the properties in an itemset.
In this algorithm an iterative approach is applied. This is a level-wise search where we mine k-frequently occurring itemset to find k+1 itemsets.
Apriori makes the following assumptions –
- The subsets of a frequent itemset must also be frequent.
- Supersets of an in-frequent itemset must also be in-frequent.
The three significant components of an Apriori Algorithm are –
- Support
- Confidence
- Lift
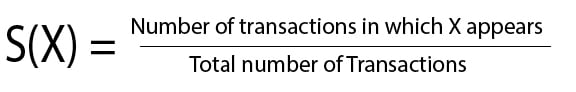
Support is a measure of the default popularity (which is a result of frequency) of an item ‘X’. Support is calculated through the division of the number of transactions in which X appears with the total number of transactions.
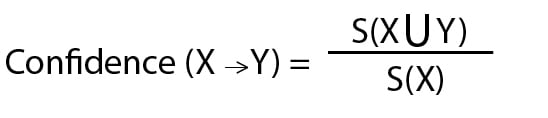
We can define the confidence of a rule as the division of the total number of transactions involving X and Y with the total number of transactions involving X.
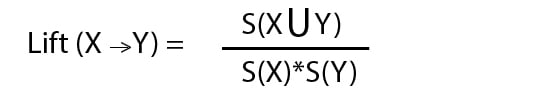
Lift is the increase in the ratio of the sale of X when you sell the item Y. It is used to measure the likelihood of the Y being purchased when X is already purchased, taking into account the popularity of the item Y.
Summary
So, these were some of the important Data Science algorithms that are used most. We discussed all the algorithms that can be implemented in the day-to-day data science operations.
Hope this data science algorithms tutorial helped you. What did you like most in this article? Leave a comment below. We would happy to read.
I recommend you to check how Data science is used in different industries
You give me 15 seconds I promise you best tutorials
Please share your happy experience on Google


I think your decision tree is mistaken.. if i’m not out of shampoo why do i care to go to the market even if it is not raining.. i think the wrong branch is extended..
Thanks for pointing, we have corrected the same.
Thank you for the insightful article on Data Science. It’s great to see such comprehensive explanations in a clear and concise manner. As someone who is already working in this field, I completely agree that continuous learning and upskilling are crucial to stay ahead. There are many advanced courses available, and I would highly recommend exploring options like the Data Science course offered by 1stepGrow institute. It’s always beneficial to expand our knowledge and acquire new skills in this rapidly evolving field.”https://1stepgrow.com/course/advance-data-science-and-artificial-intelligence-course/