Clustering in Tableau – Learn the Steps to Perform it Easily
FREE Online Courses: Elevate Your Skills, Zero Cost Attached - Enroll Now!
Another interesting functionality of Tableau is its clustering option. The clustering of data is helpful in a lot of analysis scenarios while working with Tableau. In this tutorial, we are going to understand clustering in Tableau, what is the significance of clusters and how to create and work with them.
How Clustering Works in Tableau?
Cluster analysis or clustering in Tableau is dividing a data set into segments or clusters having relevant data values. Clustering helps us conduct a comparative analysis of data in Tableau. A cluster contains similar data values of a dimension that is the values in a cluster are more related to each other than the data in other clusters. Thus, clustering is done using specific clustering algorithms where similar values are kept together as a part of the group. In Tableau, we can have a cluster of up to seven color shades or codes at a time.
For instance, if we have sales data for a product for different types of consumers or buyers. Now, we want to analyze the purchasing capacity or trends of consumers. For this, we can create clusters where we can segregate consumers based on their purchasing capacities. Now that we are able to unveil and analyze consumer’s purchasing or spending capacities, we can come up with strategies to maximize sales.
K-means Clustering in Tableau 10
In Tableau, the clustering algorithm used to create clusters on a Tableau worksheet is known as the K-means clustering algorithm. The reason behind it being called K-means is that this algorithm divides a data set into K clusters or segments based on similarity metrics. Then it calculates the mean (mean of all the values in one cluster) for each cluster which gives the Centroid (cluster center) of a cluster.
Once it calculates the centroid value for each cluster present, it places them in such a way that the total sum of distances between the centroid and concerning members in a cluster is minimum or as small as possible. In this way, the K-means algorithm gives us closely packed clusters each made of closely related or similar values.
How to Create Clusters in Tableau
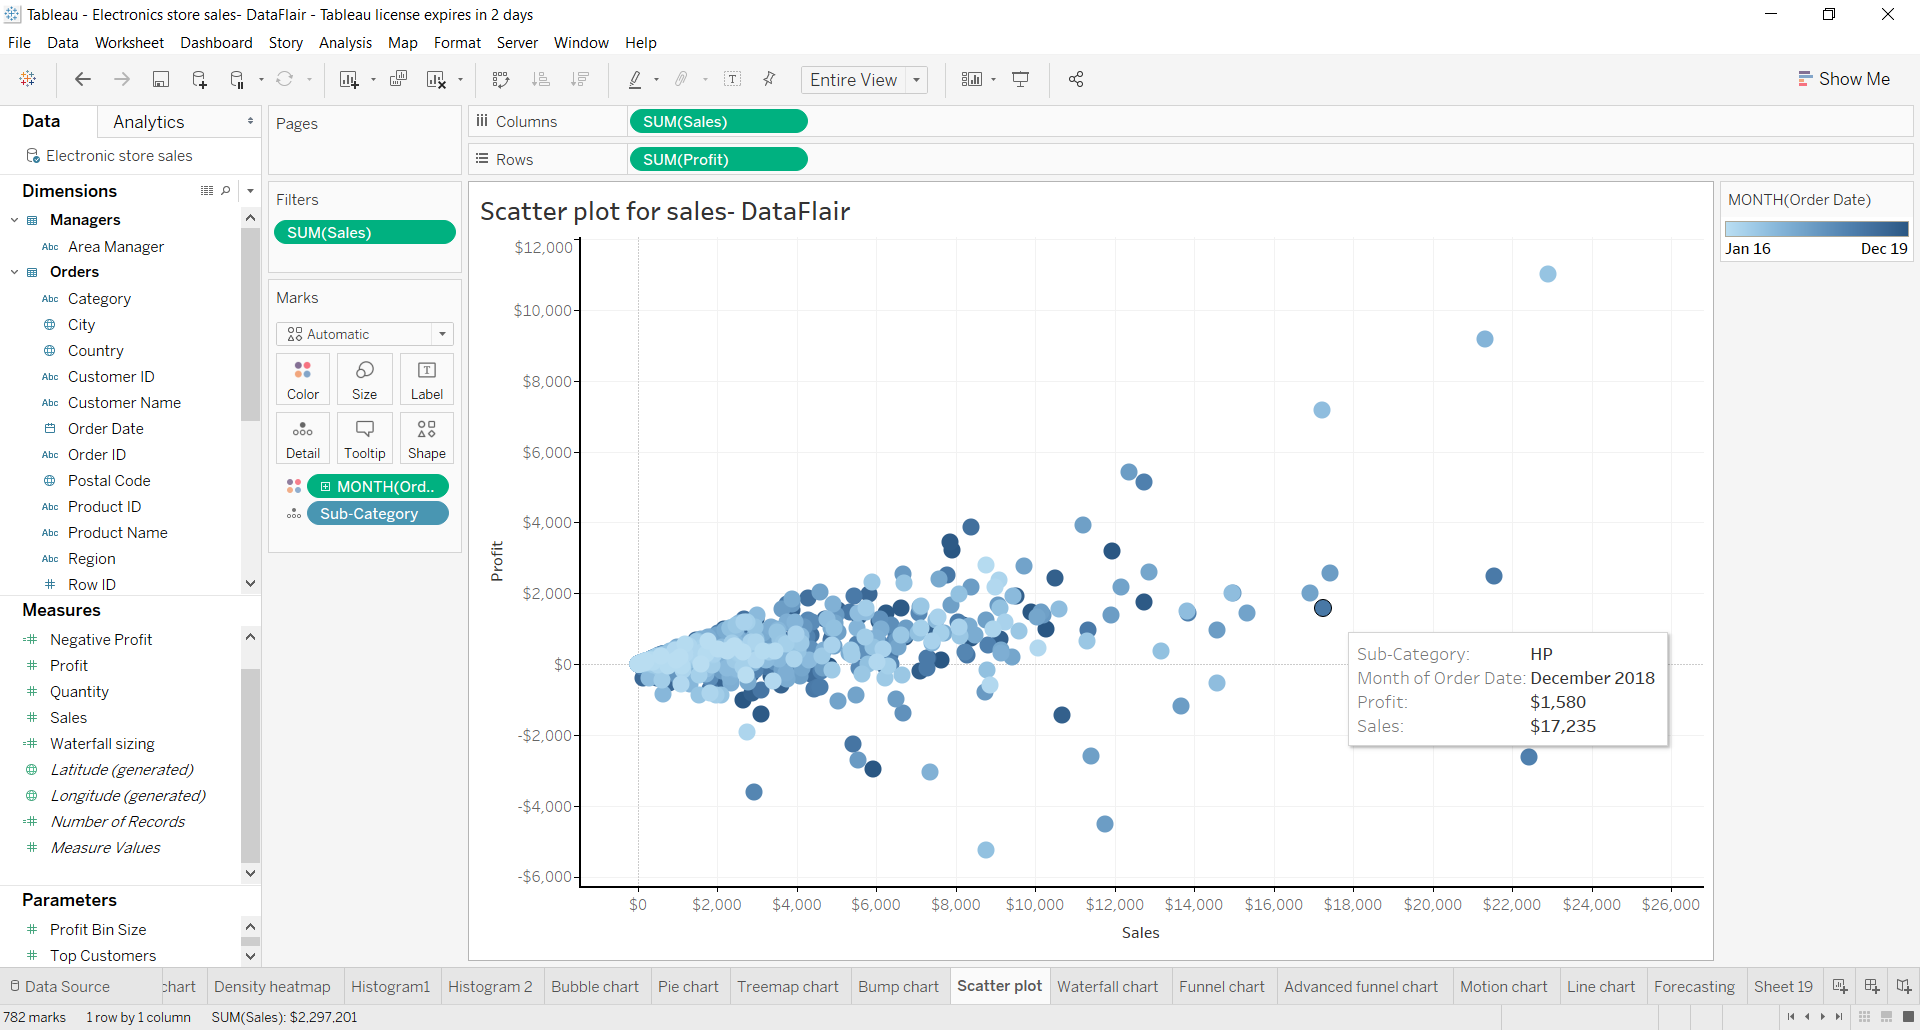
Follow the steps given below to create a cluster in Tableau. As a prerequisite to making a cluster in Tableau, we have created a scatter plot for sales.
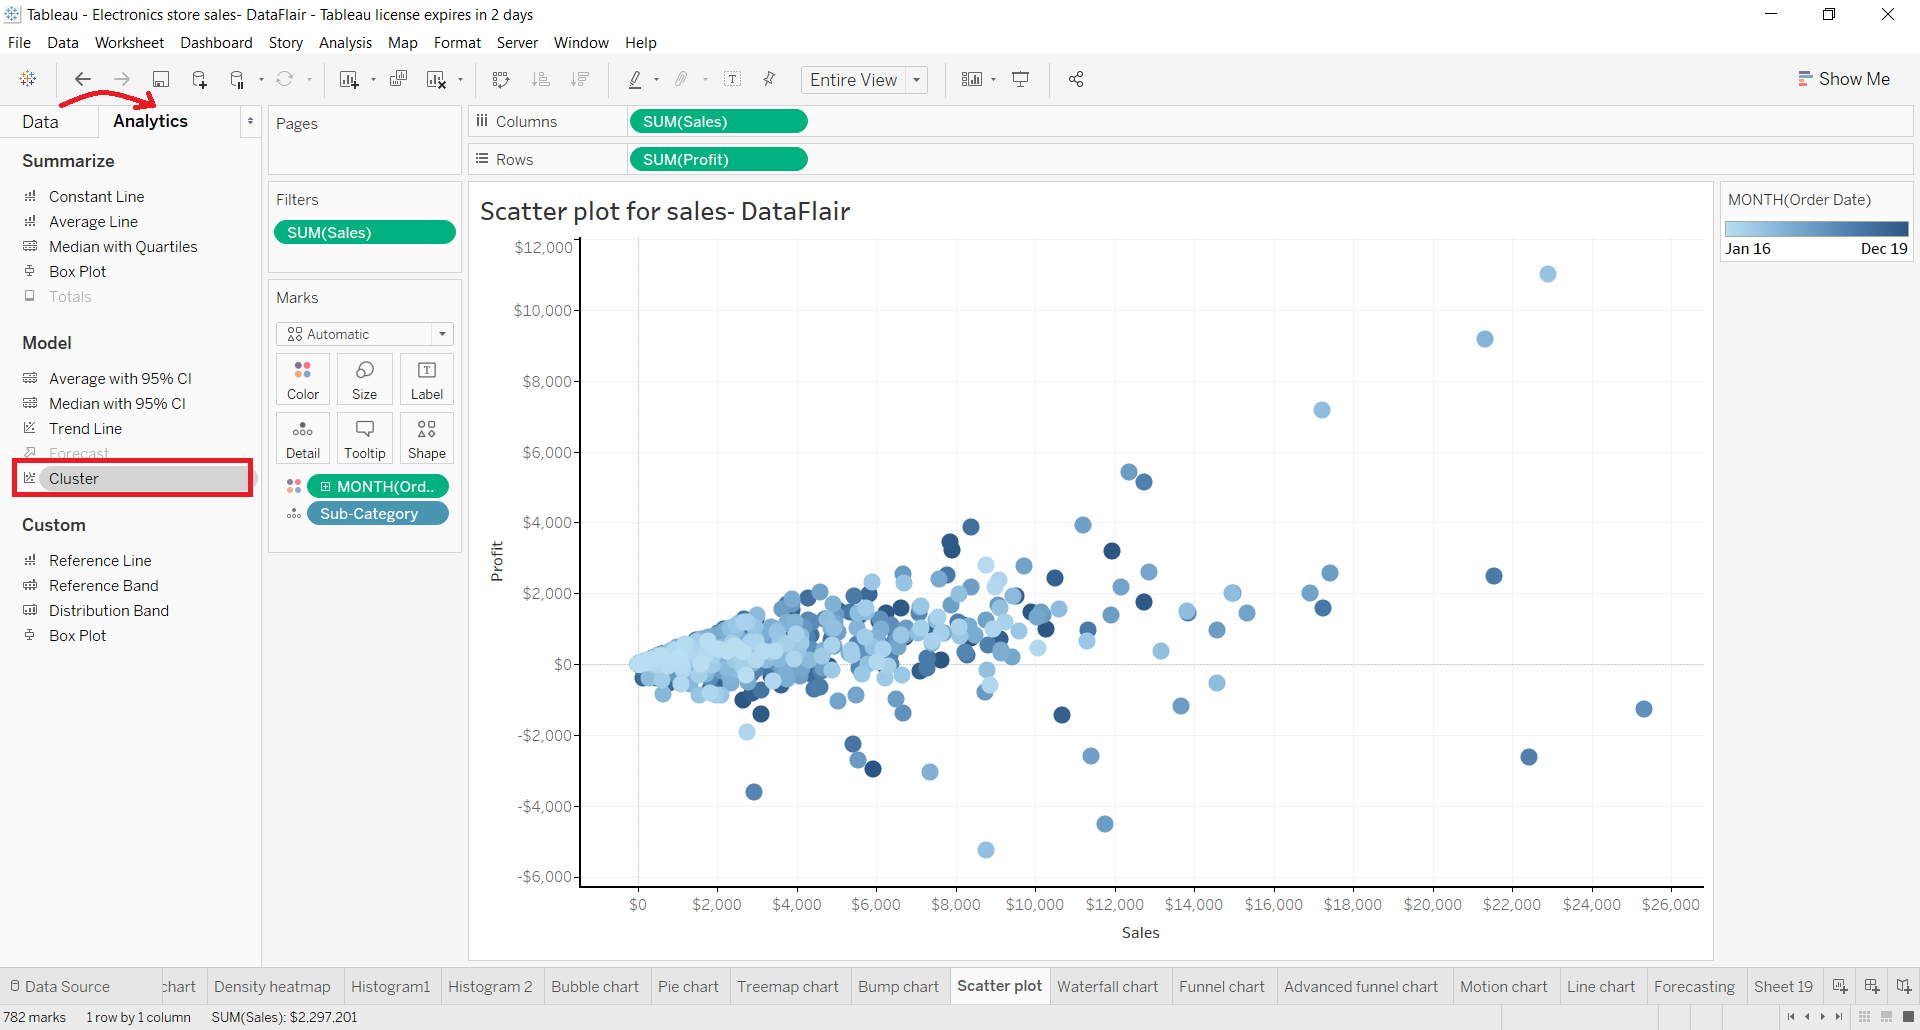
Step 1: To create a cluster, go to the Analytics tab and then select Cluster from the Model section.
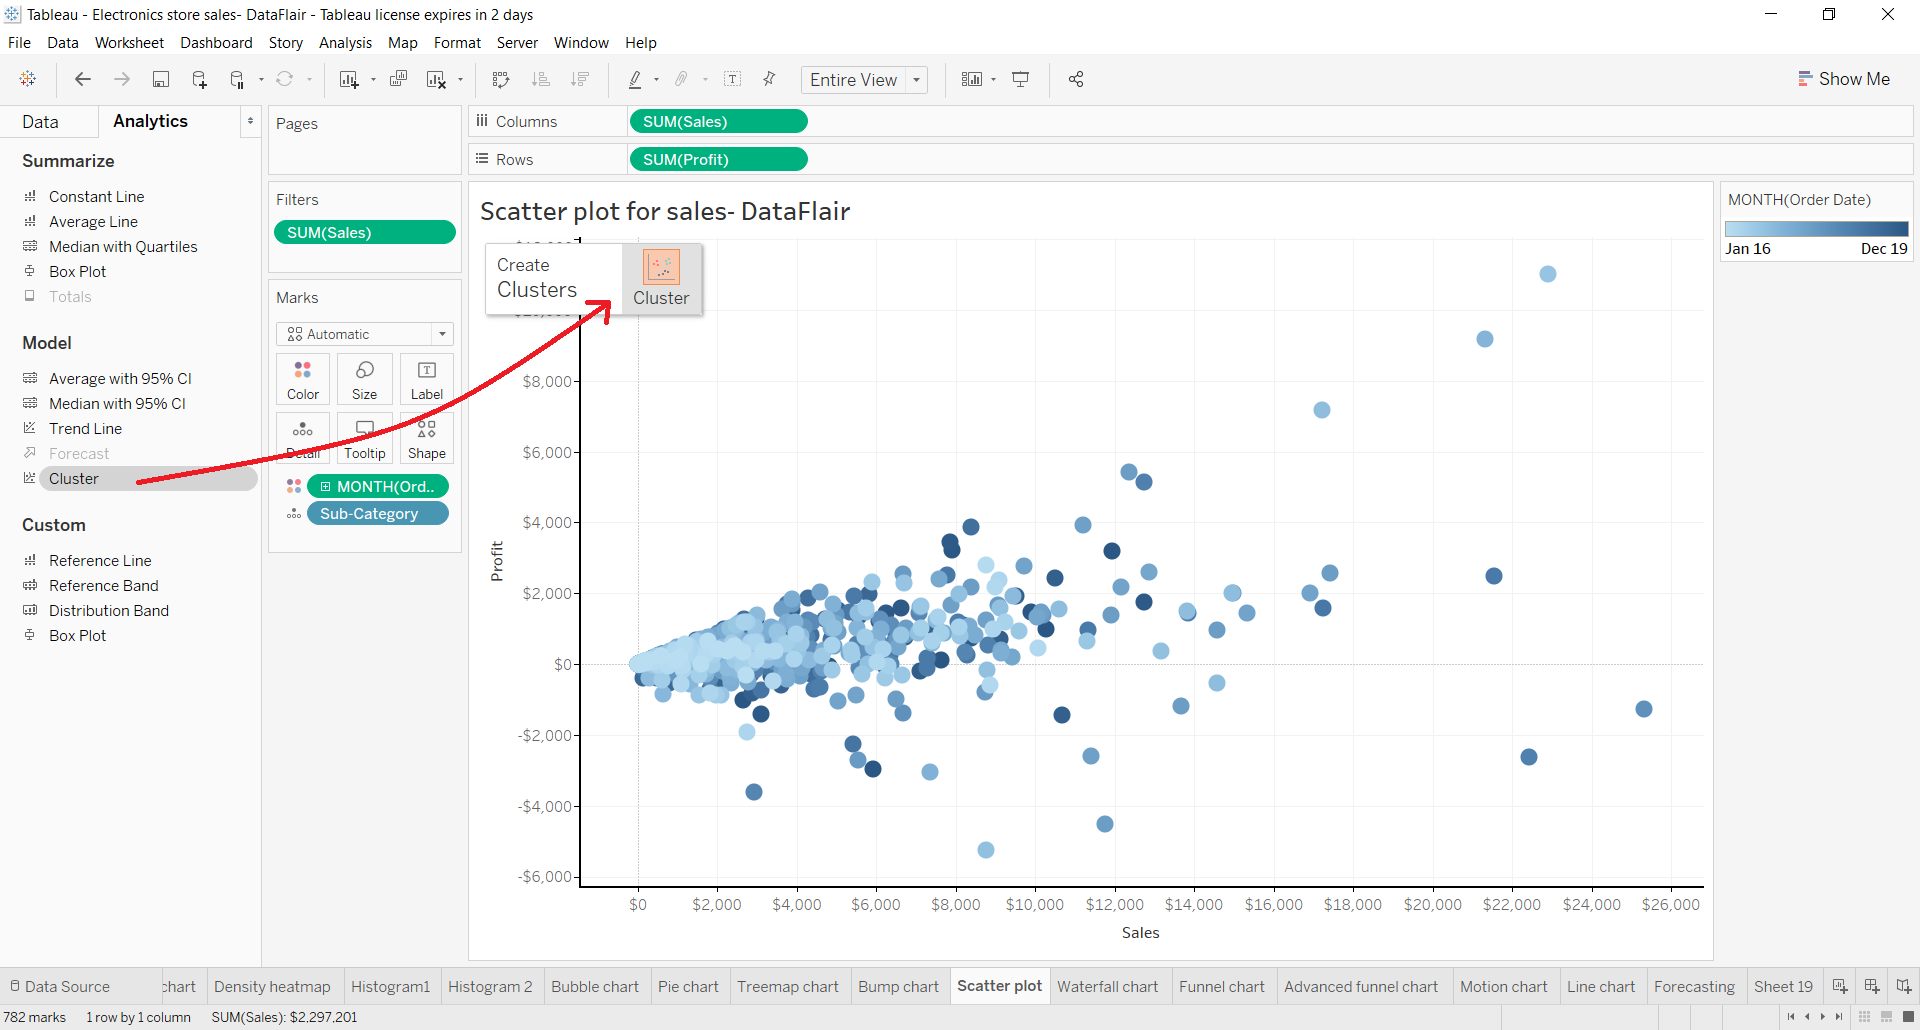
Step 2: Hold the Cluster option and then drag and drop it on the visualization area as shown in the figure below.
Step 3: A Clusters dialog box will open which has two columns; Variables and Number of Clusters. In the Variables section, you can add dimensions or measure fields to be included in the cluster. And from the Number of Clusters section, you can enter the numeric value of clusters that you want.

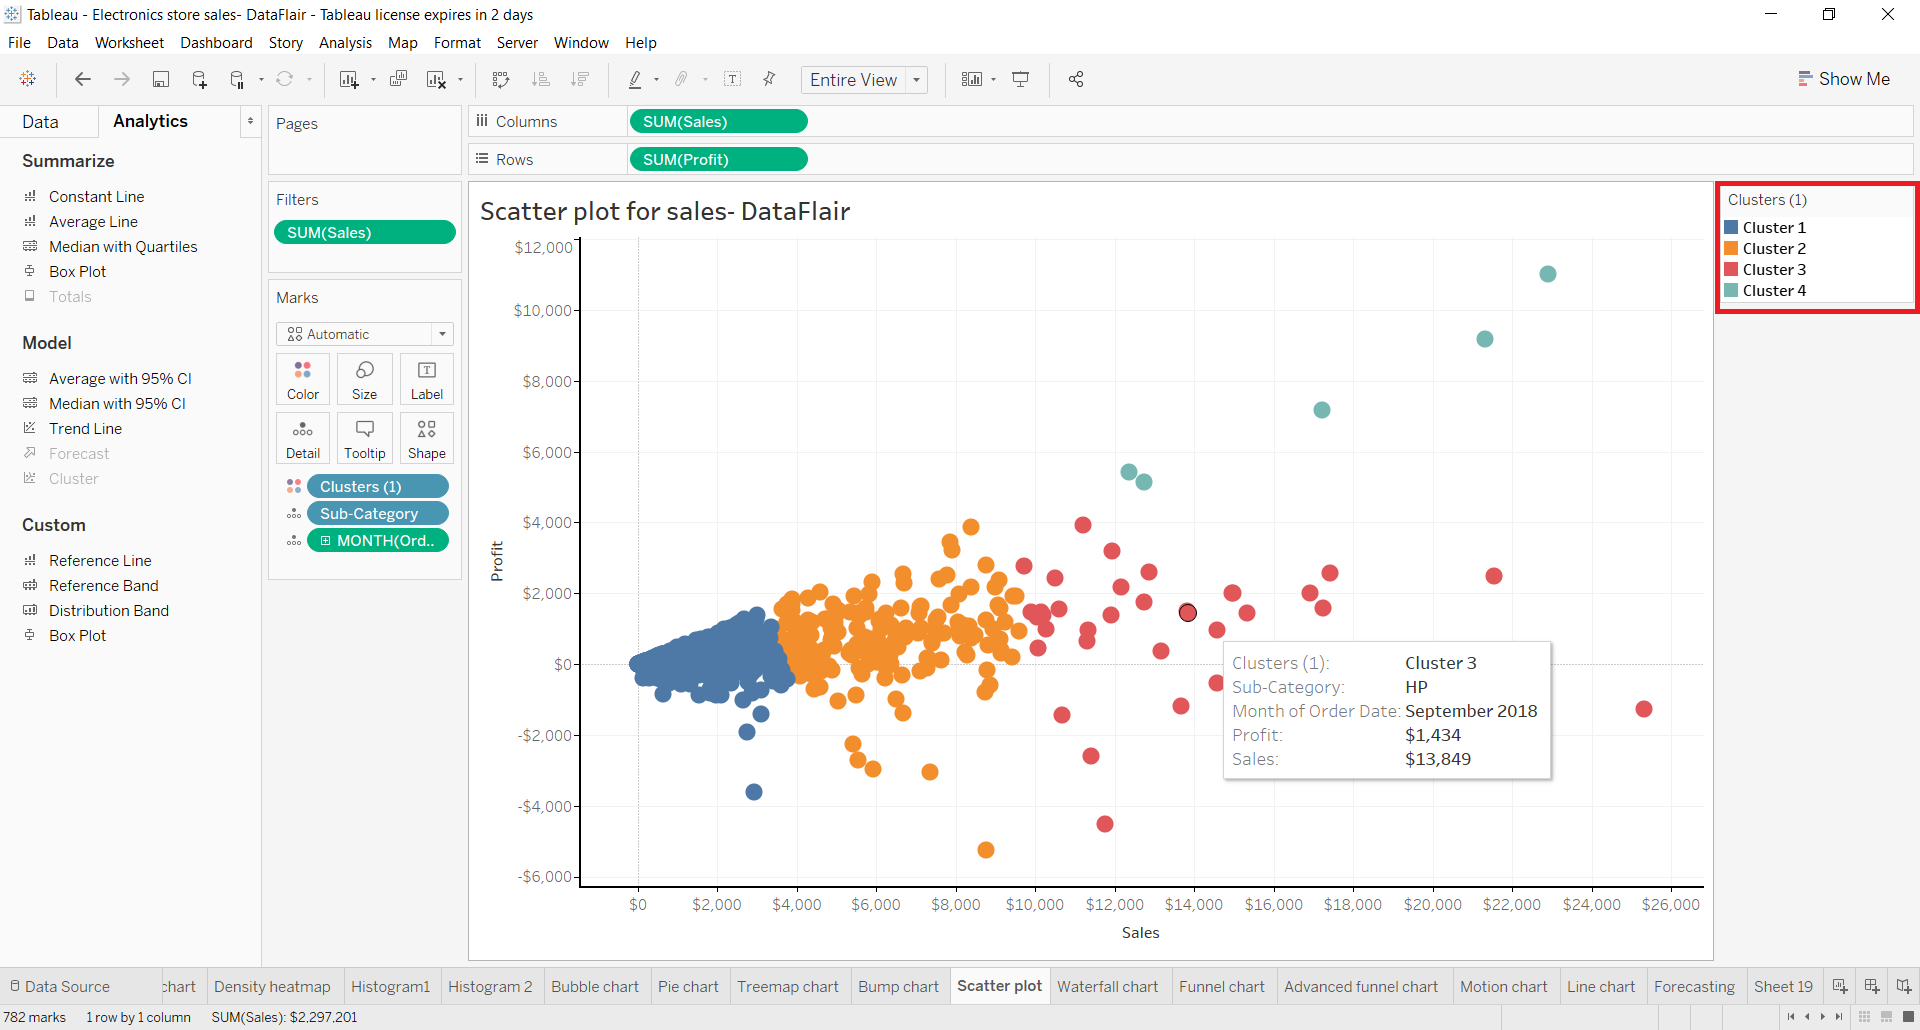
Once we are done with setting up all the cluster settings, we will have a cluster of data values formed in the visualization area. On the extreme right, we can see each cluster name with their corresponding colors. Here, it shows four clusters as (Cluster 1, Cluster 2, Cluster 3 and Cluster 4) as we set the Number of Clusters value as 4 in the earlier step.
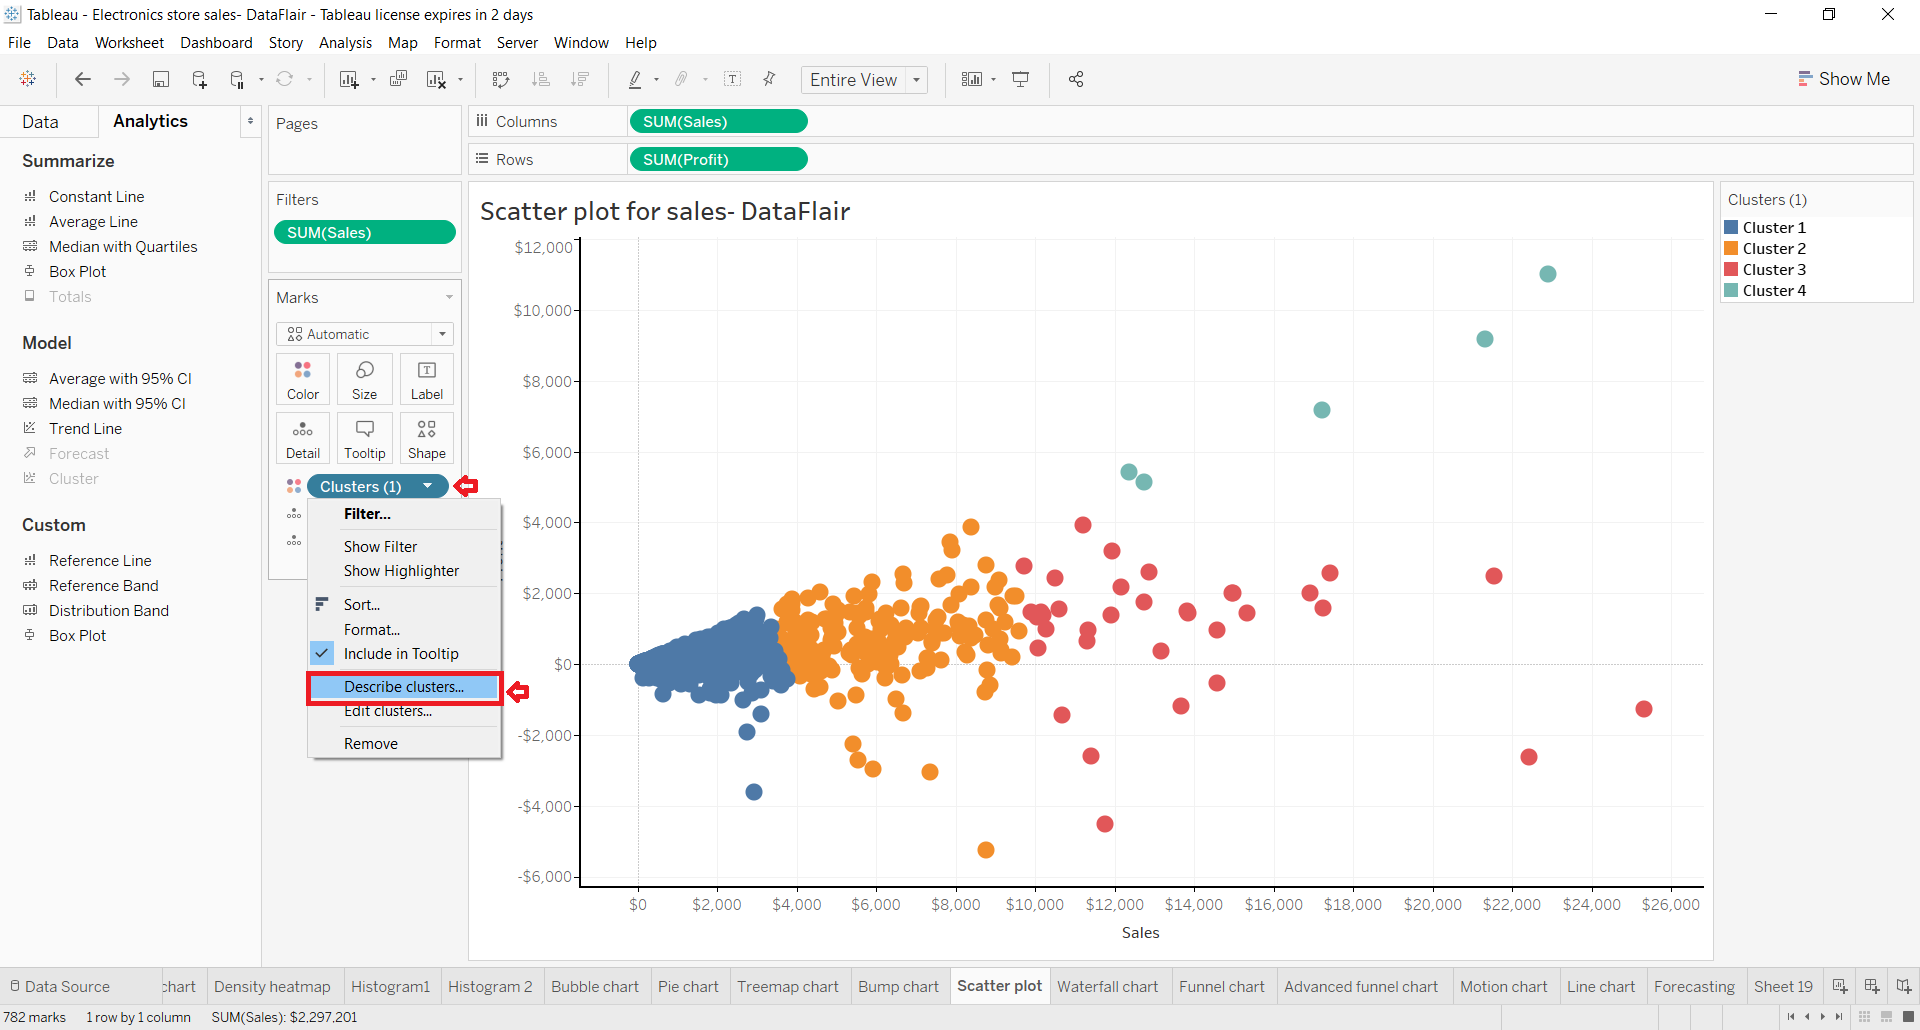
Step 4: On the panel at the left, we have the Cluster (1) showing from where we can explore and manage the properties of a cluster further. To access the drop-down menu, click on the arrow given right next to Cluster (1). To see the description of the cluster, click on Describe clusters… option.]
This will open a detailed description window for the active cluster. In this Describe Clusters window, there are two tabs; Summary and Models. The summary section gives a detailed summary of the cluster made giving information about variables, level of detail, scaling, number of clusters, number of points, the total sum of squares along with information on each cluster. The Models section describes the cluster model type.

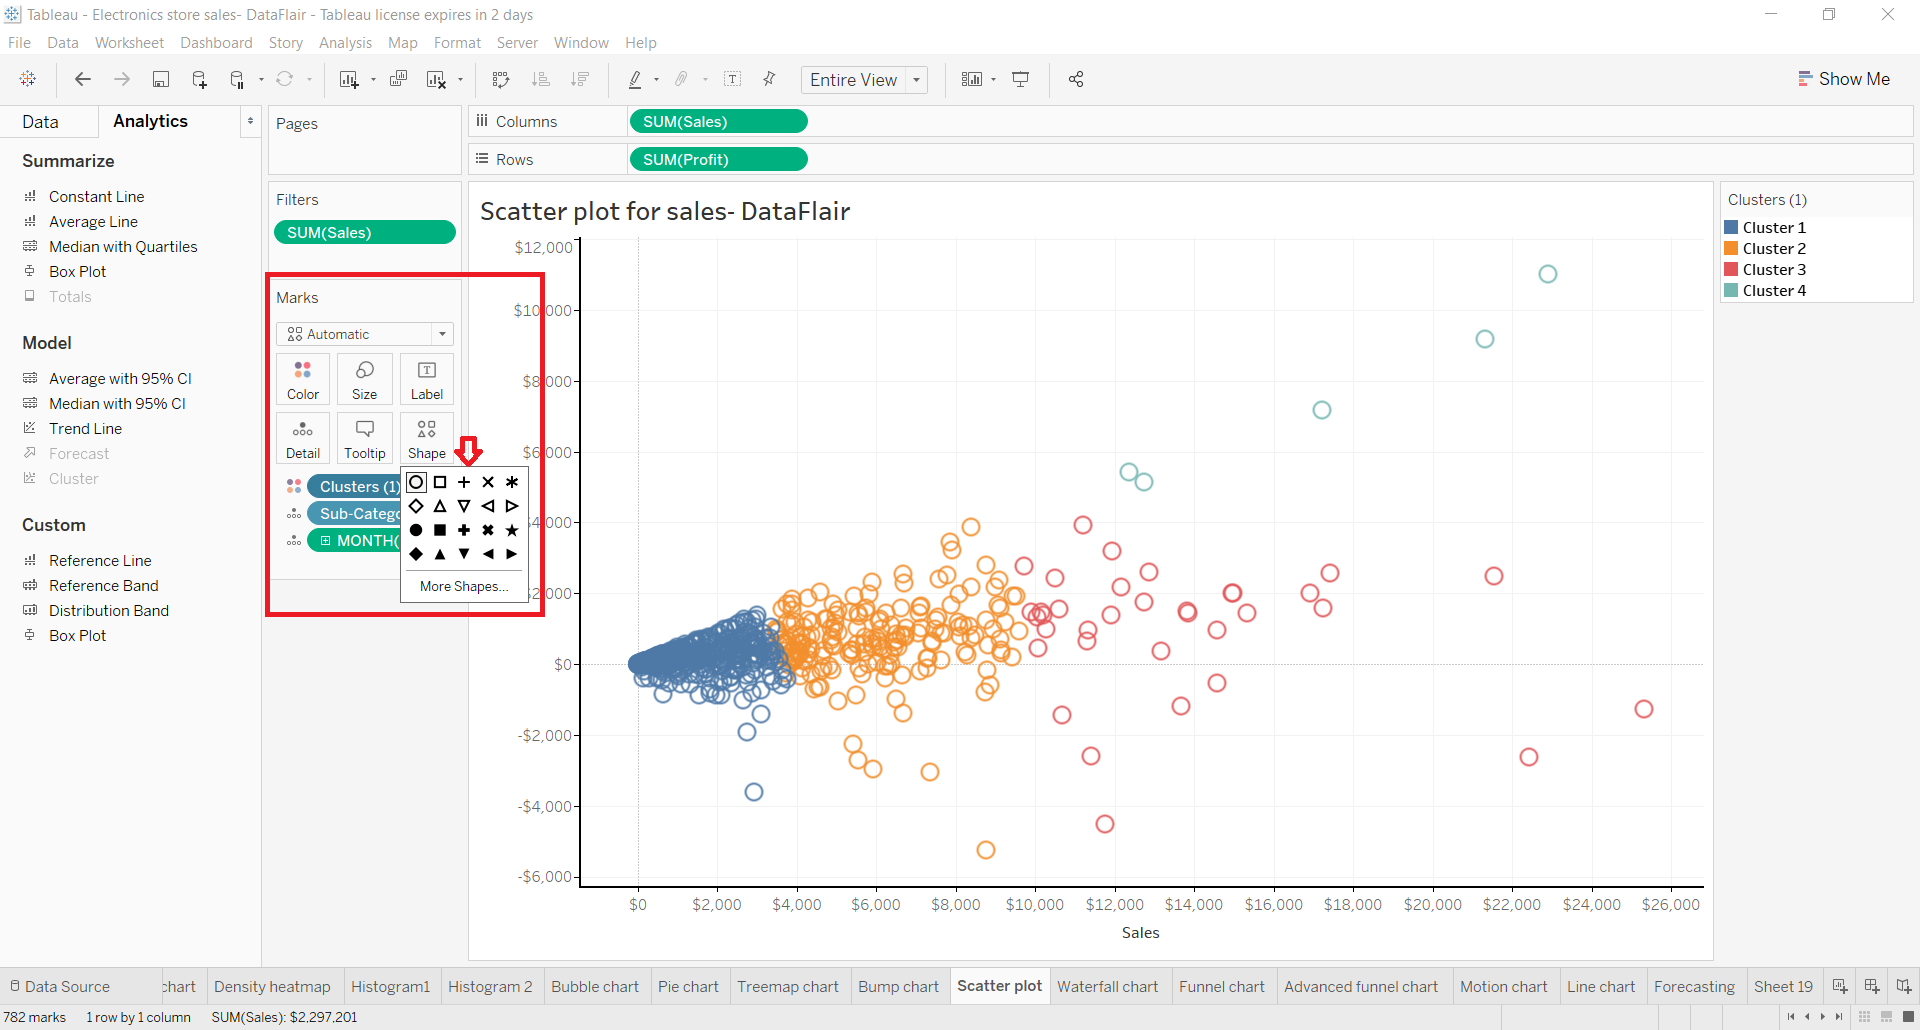
Step 5: We can also change the shape of each cluster point from the Shape card present on Marks section as shown in the screenshot below. (To view the full screenshot, please click on it). This option will give us a range of different shapes to select from.
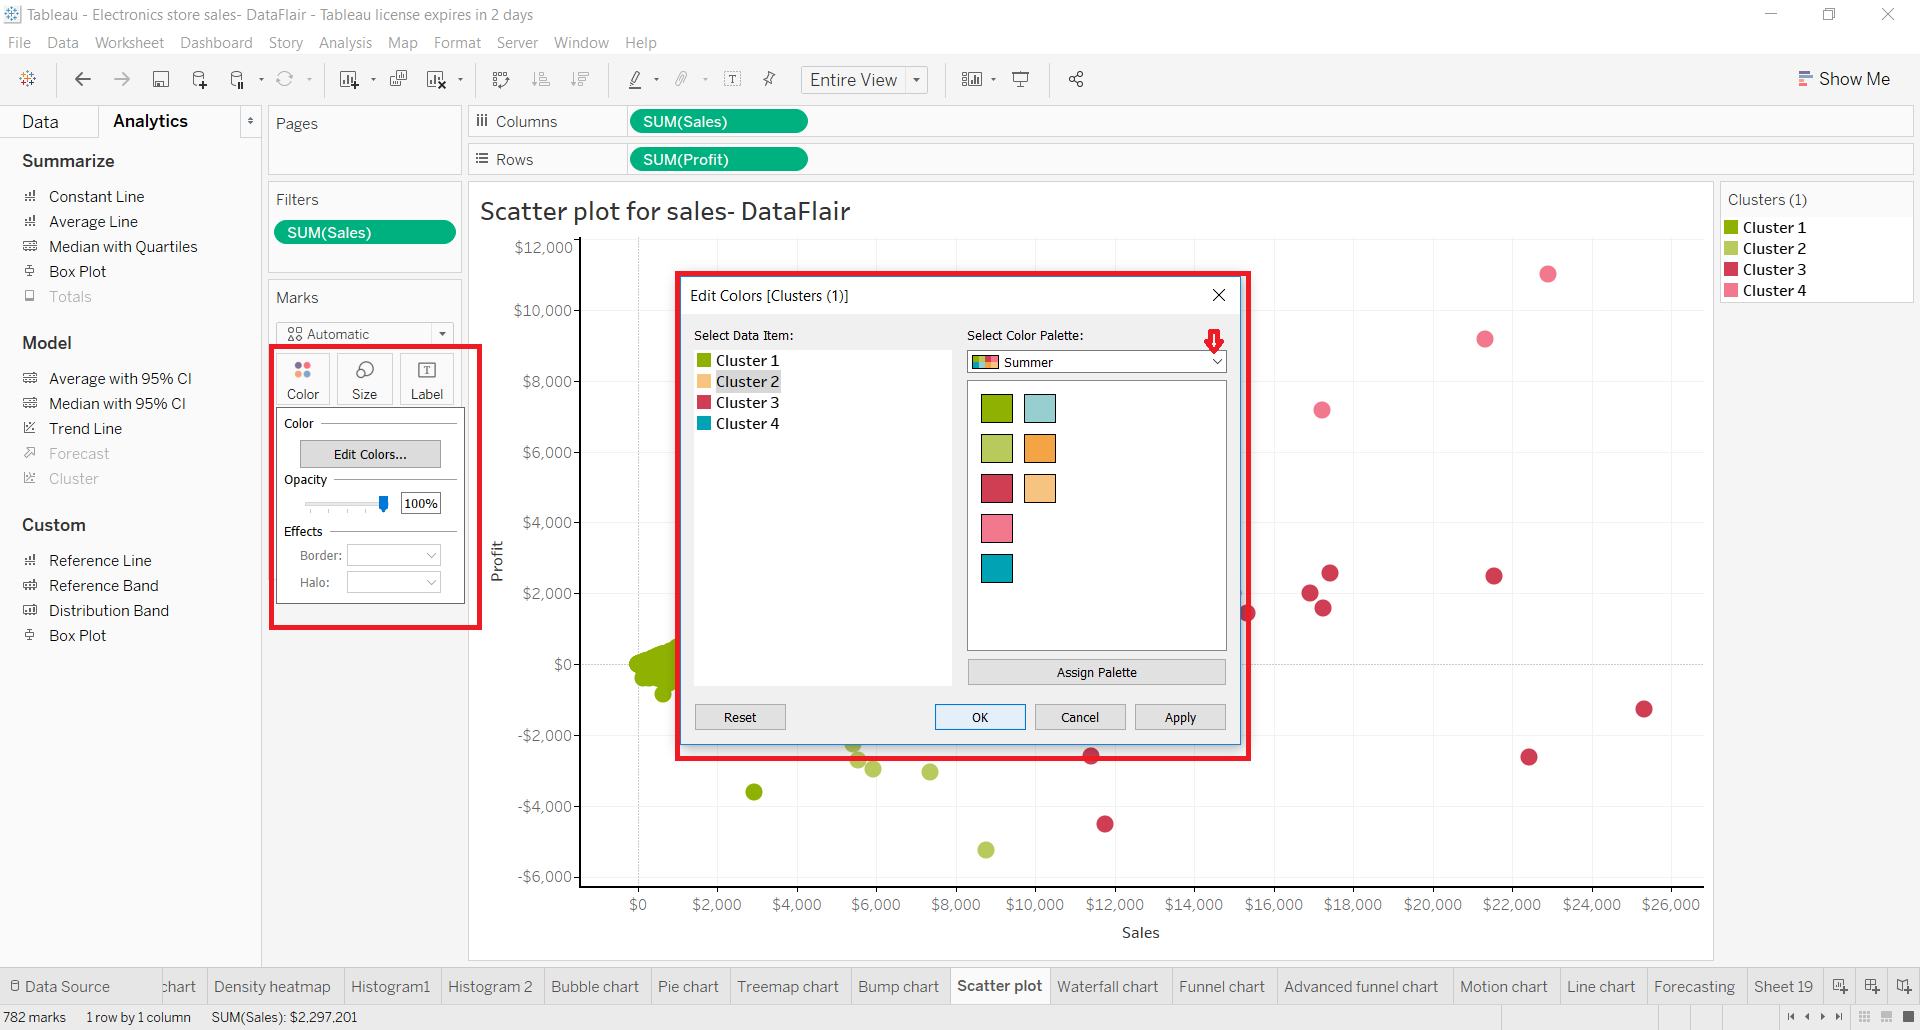
Step 6: Also, we can change the color scheme of the cluster by clicking on the Color option present on the Marks section. From the window that opens, we can see the current color scheme, select a new color palette and assign that palette to the cluster.
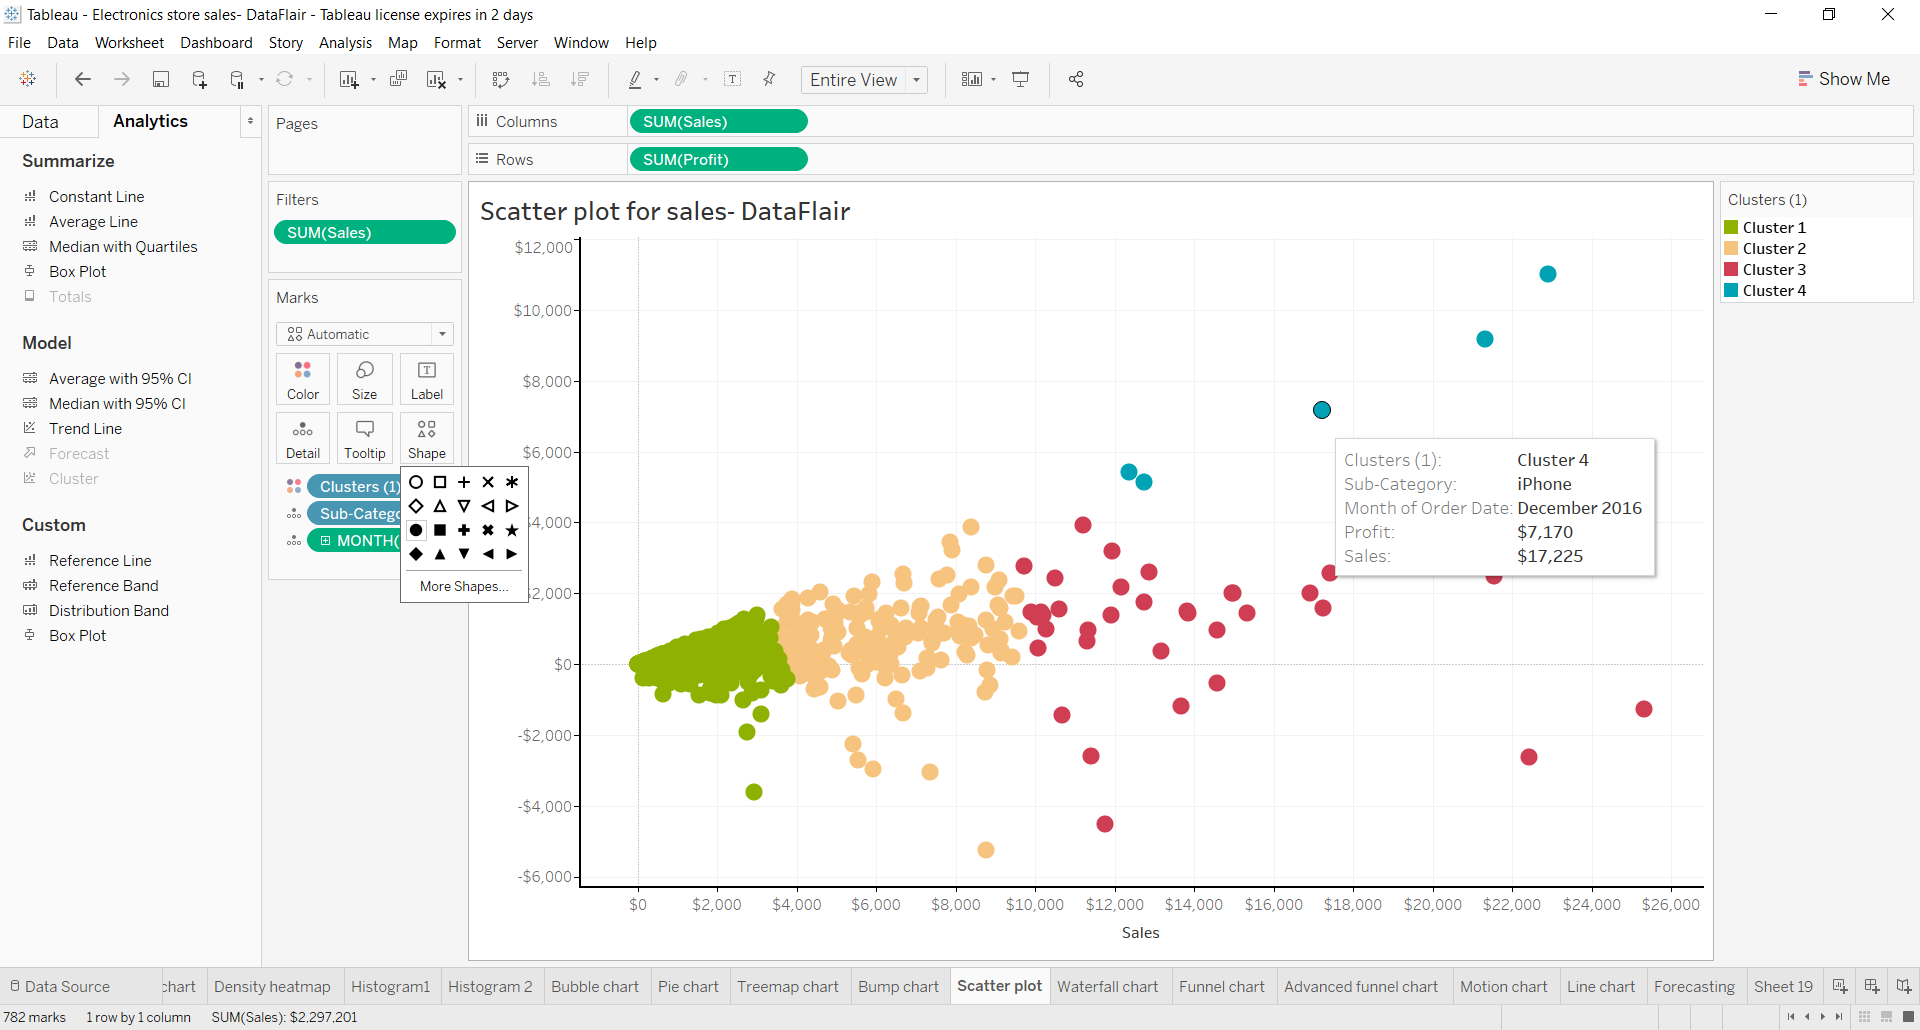
As we can see in the screenshot below, the color scheme of the cluster is now changed.
Clustering Constraints in Tableau
There are certain conditions where we cannot use the clustering option in Tableau.
- Clustering is not available for authoring on the web like on Tableau Server, Tableau Online, etc. However, it is available on the Tableau Desktop.
- Clustering is not available when you are using a cube (multidimensional) data source.
- Clustering is not available when there is a blended dimension in the view.
- When we do not have fields that we can use as variables or inputs for clustering in the view.
- Clustering is not available when there are no dimensions present in an aggregated view.
- When the data have field types like table calculations, Blended calculations, Ad-hoc calculations, Generated latitude/longitude values, Groups, Sets, Bins, Parameters, Dates, Measure Names and Measure Values. These cannot be used as variables or inputs for clustering.
Summary
This brings our tutorial on clustering or cluster analysis in Tableau to an end. Here, we learned what is clustering in Tableau, understood the algorithm used in clustering that is K-means algorithm and learned how to create clusters in Tableau.
We hope you liked this tutorial. If there is anything that you would like us to improve, do mention in the comment section.
If you are Happy with DataFlair, do not forget to make us happy with your positive feedback on Google

