Aggregation and Grouping in Pandas explained by Experts
Free Pandas course with real-time projects Start Now!!
Pandas is popularly known as a data analysis tool, which is offering a data manipulation library. With the help of this feature, we can analyze large data in an efficient manner. Here, we can apply common database operations like merging, aggregation, and grouping in Pandas.
This article will provide you a bunch of information about aggregation & grouping of data in Pandas. By the end of this article, you can apply sum(), max(), min(), mean(), and medium() functions on your dataframes.
Aggregation and Grouping in Pandas
1. Aggregation in Pandas
Pandas provide us with a variety of aggregate functions. These functions help to perform various activities on the datasets. The functions are:
- .count(): This gives a count of the data in a column.
- .sum(): This gives the sum of data in a column.
- .min() and .max(): This helps to find the minimum value and maximum value, ina function, respectively.
- .mean() and .median(): Helps to find the mean and median, of the values in a column, respectively.
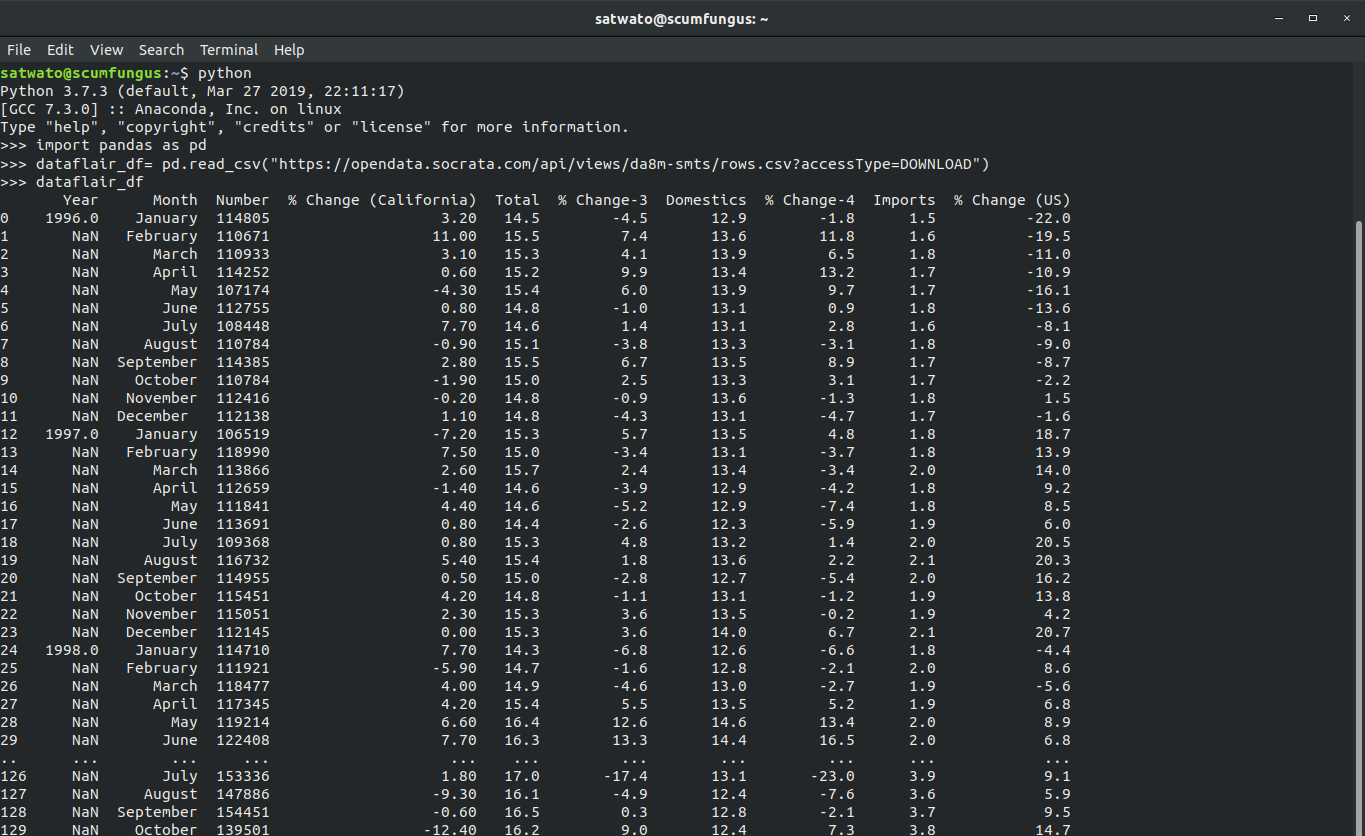
First, we start by importing pandas as pd
>>> import pandas as pd
Then we import a dataset:
>>> dataflair_df= pd.read_csv("https://opendata.socrata.com/api/views/da8m-smts/rows.csv?accessType=DOWNLOAD")This dataset is about car sales. We will enter our DataFrame name “dataflair_df” to see the dataset.
Before we move ahead I recommend to revise the concept of Pandas Dataframe
Output-
1.1 .count() function
To start off, the first function of aggregation that we are going to try is .count()
>>> dataflair_df.count()
Therefore, we see that the .count() function returns the number of entries for every column.
If we want to count a particular column, then we use:
>>> dataflair_df[["Year"]].count()
Or we use:
>>> dataflair_df.Year.count()
Output-
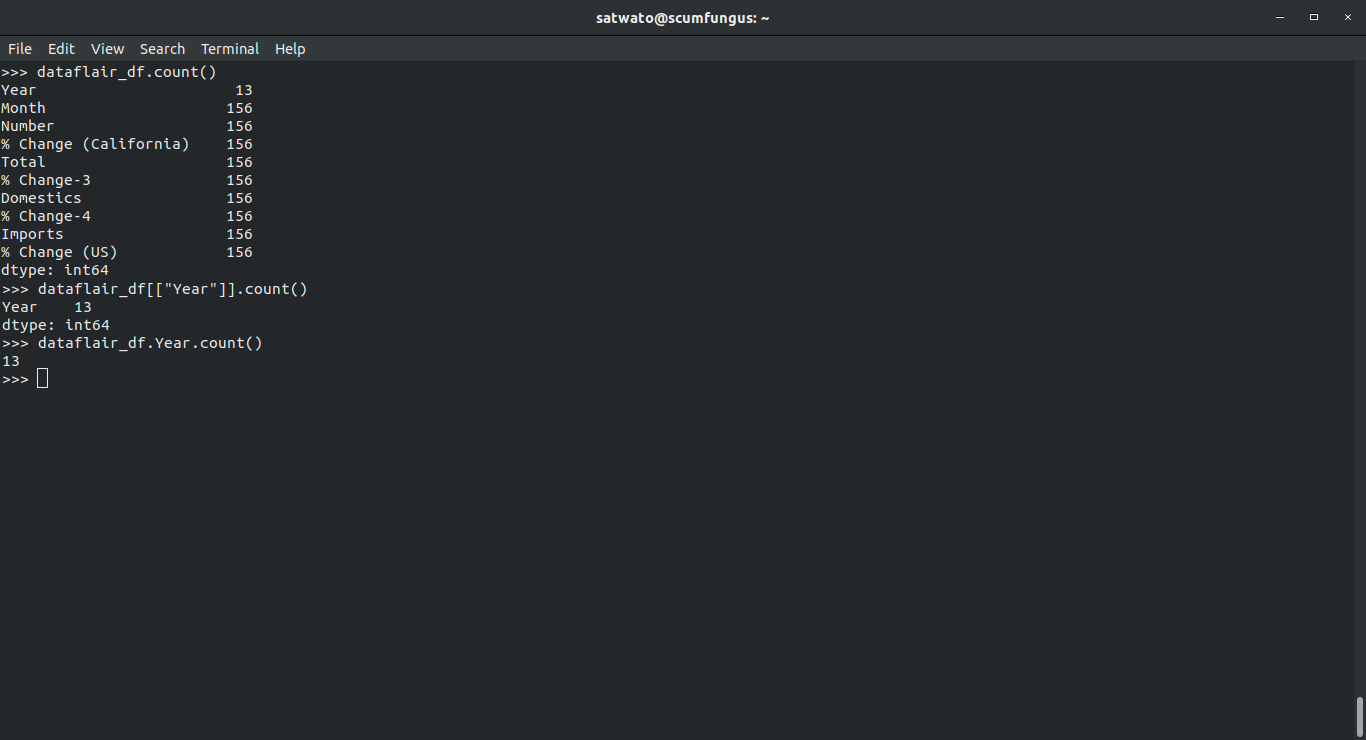
Both will yield the same result. The first one returns a Pandas DataFrame object and the second one returns a Pandas Series object.
1.2 .sum() function
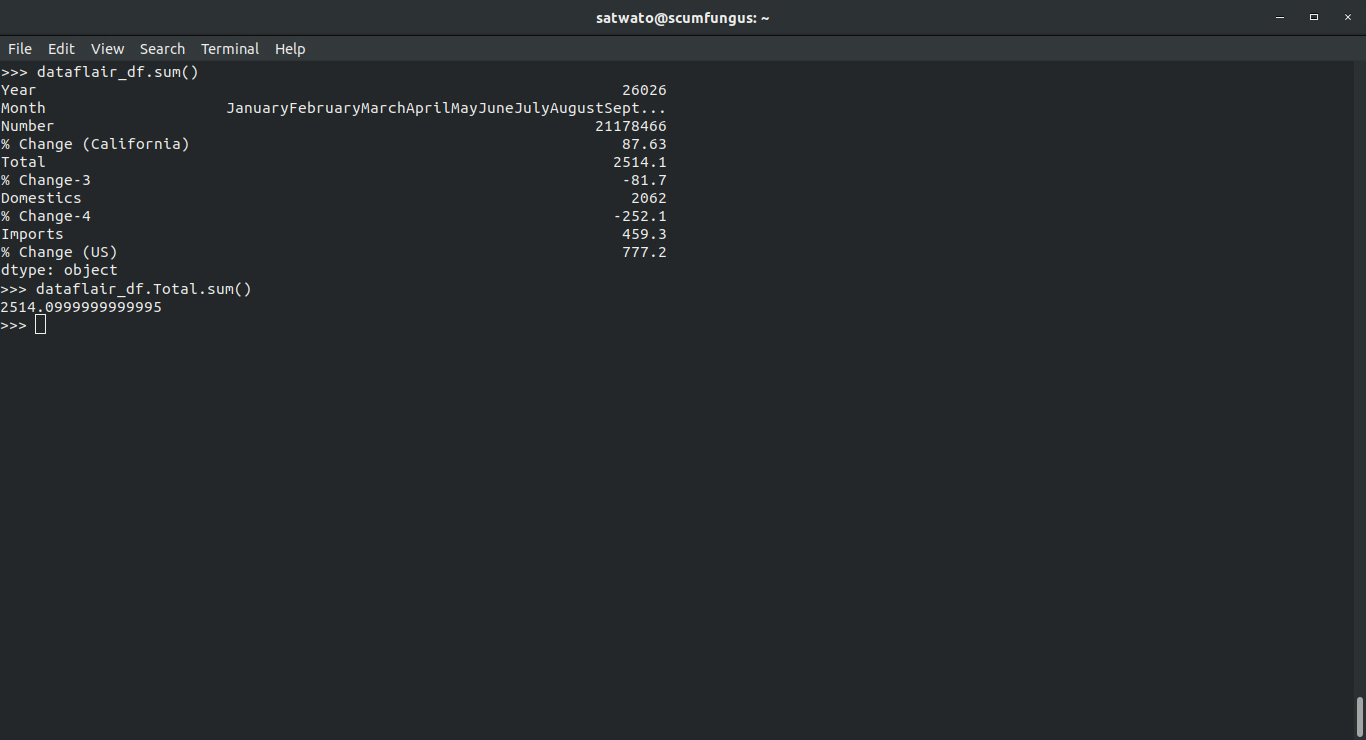
We can use the .sum function to find the sum of elements in a column.
>>> dataflair_df.sum()
But we do not always need to find the sum of all the columns. For only one column, we use:
>>> dataflair_df.Total.sum()
This will give us the sum of the values in the column Total.
Output-
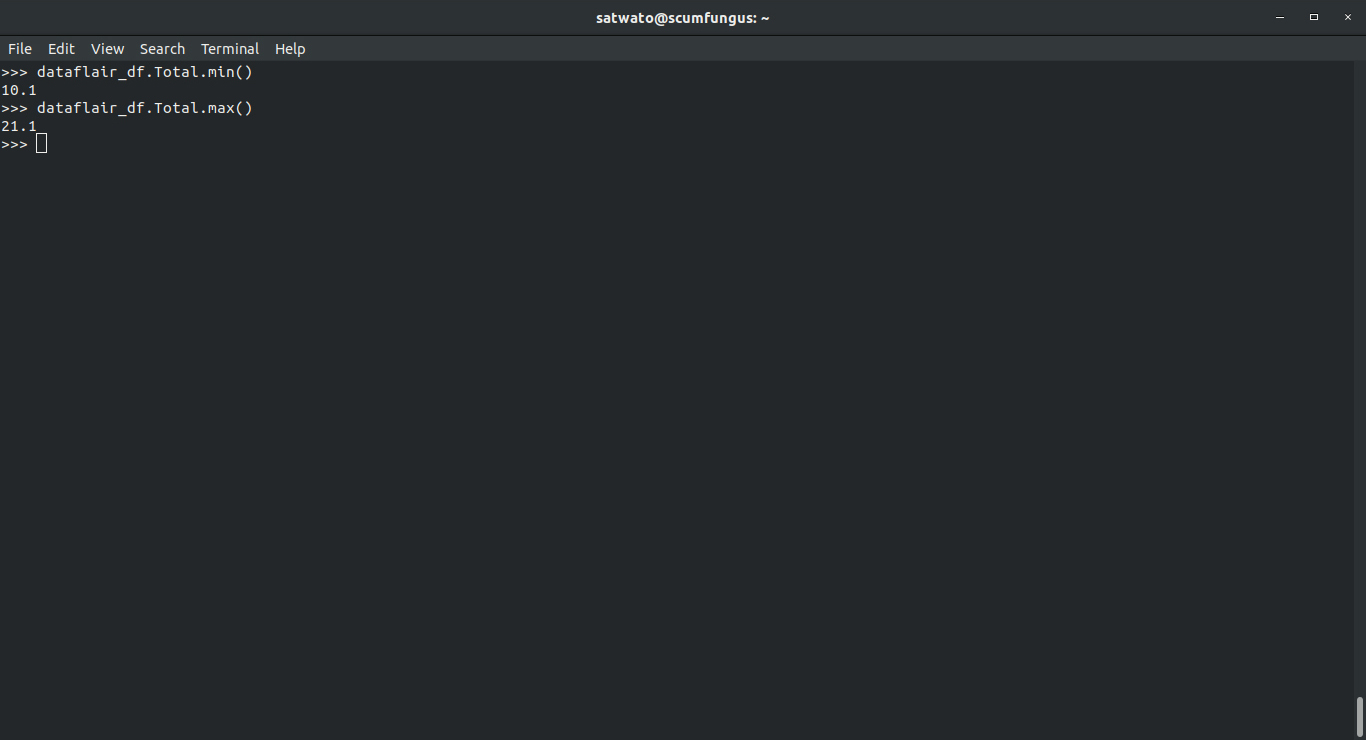
1.3. min() and max() function
We can find the minimum and maximum values of the dataset using function min() and max() function in pandas:
Use this code to find minimum value:
>>> dataflair_df.Total.min()
For finding the maximum value, we will use:
>>> dataflair_df.Total.max()
Output-
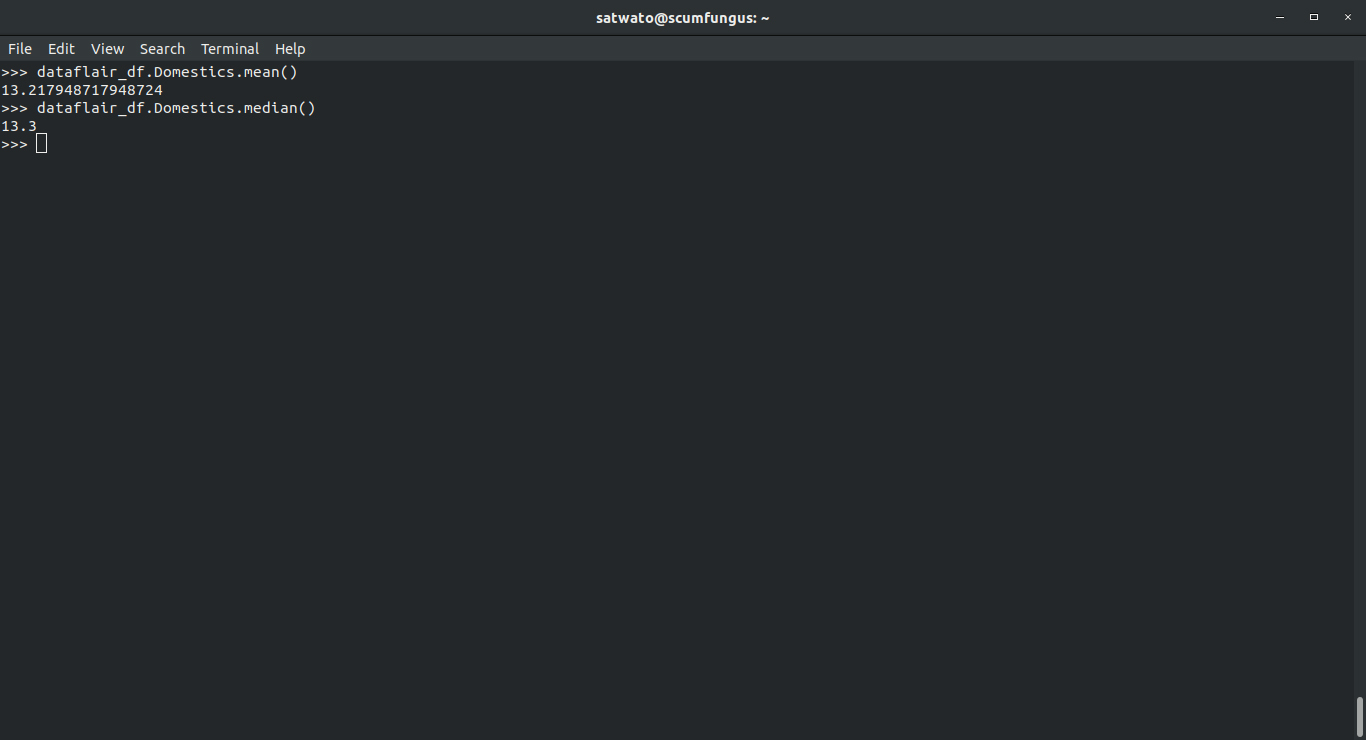
1.4 mean() and median() function
The functions of the mean() and median() are to find the mean and median, as it can be seen.
>>> dataflair_df.Domestics.mean()
This is finding the mean or average of the column named “Domestics”
We can find the median too:
>>> dataflair_df.Domestics.median()
Output-
2. Grouping Function in Pandas
Grouping is an essential part of data analyzing in Pandas. We can group similar types of data and implement various functions on them.
For grouping in Pandas, we will use the .groupby() function to group according to “Month” and then find the mean:
>>> dataflair_df.groupby("Month").mean()Output-
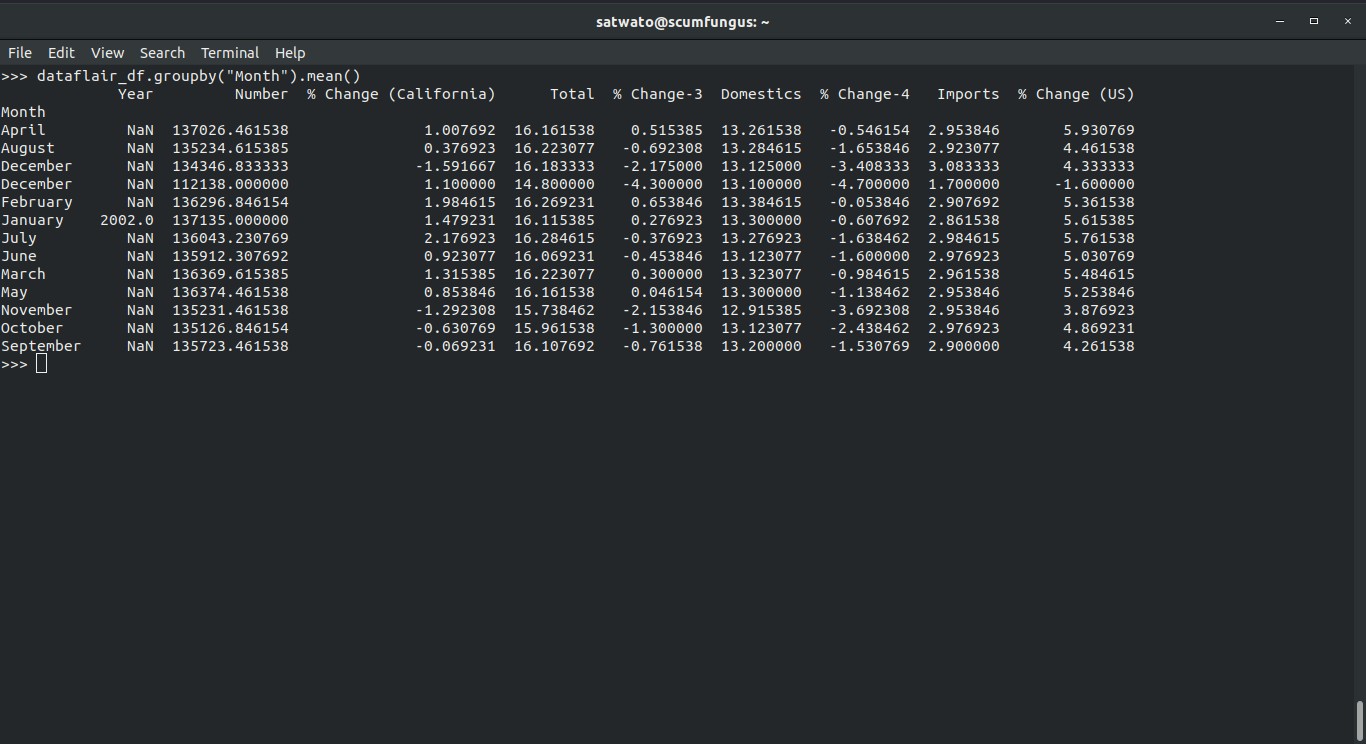
Here, we saw that the months have been grouped and the mean of all their corresponding column has been calculated.
Do to know the difference between grouping merging and joining in Pandas.
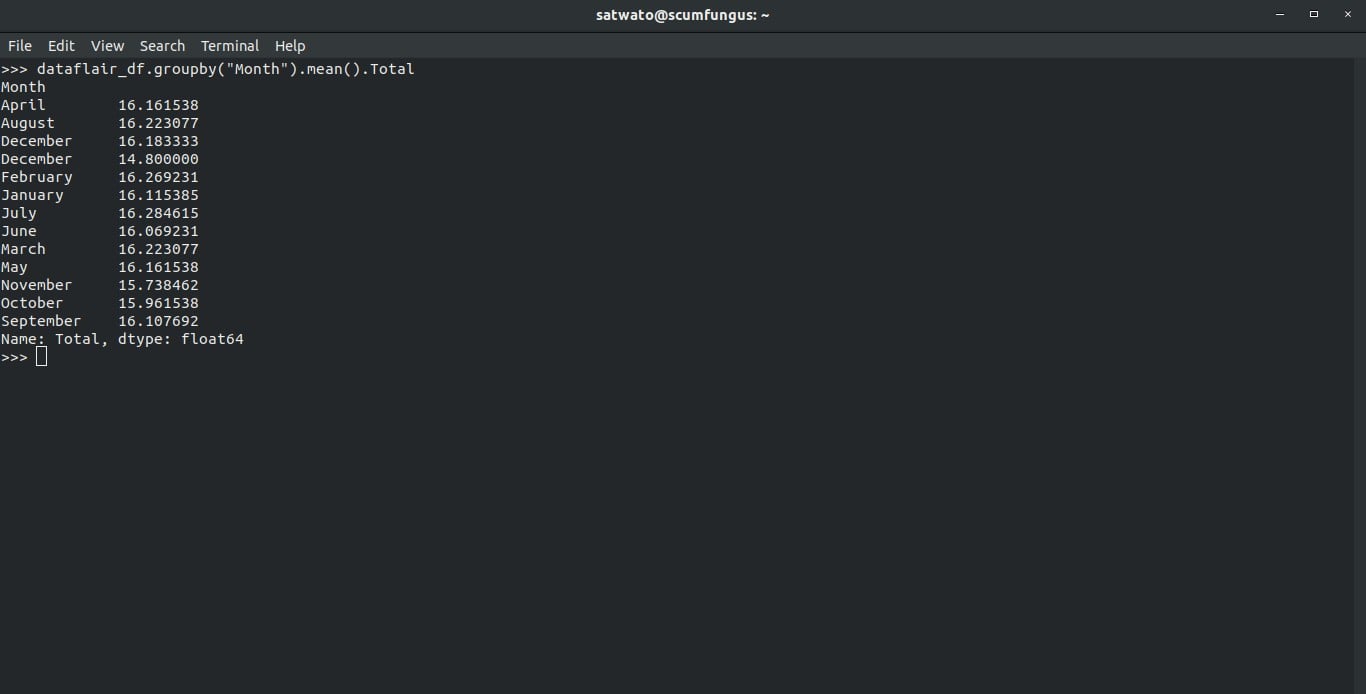
- But, if we want to find the mean of a single column of our choice, we will use:
>>> dataflair_df.groupby("Month").mean().TotalWhere “Total” can be replaced with any other column name too.
Output-
We can use the aggregate function to implement various functions like min, max, median, etc. all at once. The aggregate function also takes parameter in the form of Strings as well as a function or list.
>>> dataflair_df.groupby("Month").aggregate(['min', max])Output-
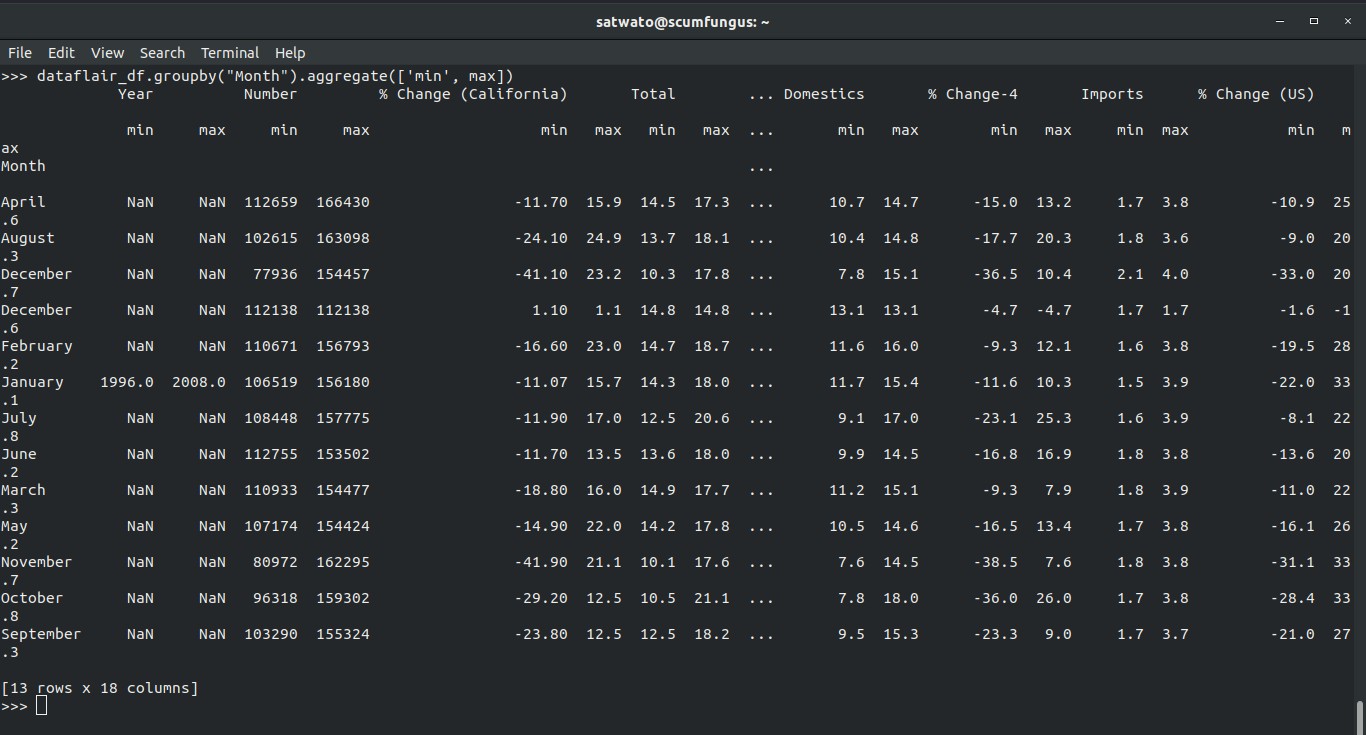
Noticed, the first parameter is in the form of a string and the next parameter is in the form of function.
This has not only grouped the data but implemented more than one function on the data columns.
Summary
In this article, we saw how easily we can aggregate and group the data. In addition, we learnt how to apply various functions on pandas dataframes. Hopefully, all your concepts have been cleared with a clear understanding of aggregating and grouping in Pandas.
It’s time to explore 3 unique ways for Pandas iteration
Leave your queries in the comments section.
Your 15 seconds will encourage us to work even harder
Please share your happy experience on Google

