5 Min Tutorial – SAS Linear Regression with PROC REG Procedure
FREE Online Courses: Your Passport to Excellence - Start Now
In last SAS tutorial, we discuss SAS Scatter Plot. Today we will look at a statistical procedure called SAS linear regression and how Linear Regression is used in SAS to indicate a relationship between a dependent and an independent variable.
Moreover, we will also discuss Proc Reg procedure and SAS Linear regression between two variables with some examples of Linear regression in SAS Programming language.
So, let’s start Linear Regression in SAS Programming Language.
SAS Linear Regression
Linear regression in SAS is a basic and commonly use type of predictive analysis. Linear regression estimates to explain the relationship between one dependent variable and one or more independent variables.
The variable we are predicting is called the criterion variable and is referred to as Y. The variable we are basing our predictions on is called the predictor variable and is referred to as X.
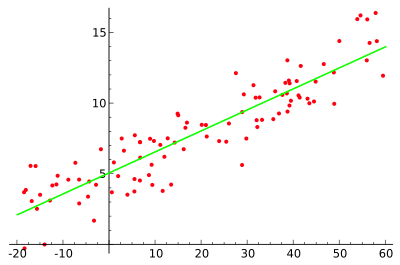
SAS linear regression plot looks like the one shown below.
SAS Linear Regression Example
SAS PROC REG Procedure
The SAS PROC REG procedure is use to find the linear regression model between two variables.
Syntax-
PROC REG DATA = dataset;
MODEL variable1 = variable2;
Here variable1 and variable2 are dependent and independent variables respectively.
SAS Linear Regression Between Two Variables
Below we will use a class dataset from the SAS help library. We now fit a linear regression model, with weight Y (dependent or outcome) variable and height as the X (independent or predictor) variable, using Proc Reg.
Example-
proc reg data=sashelp.class;
model weight= height ;
run;
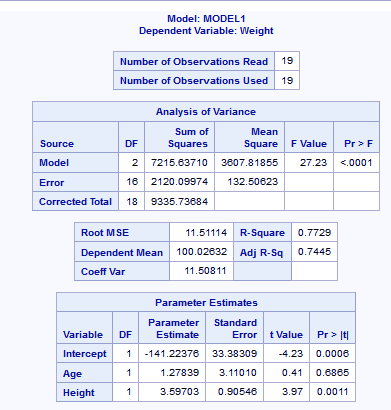
Linear Regression Between Two Variables
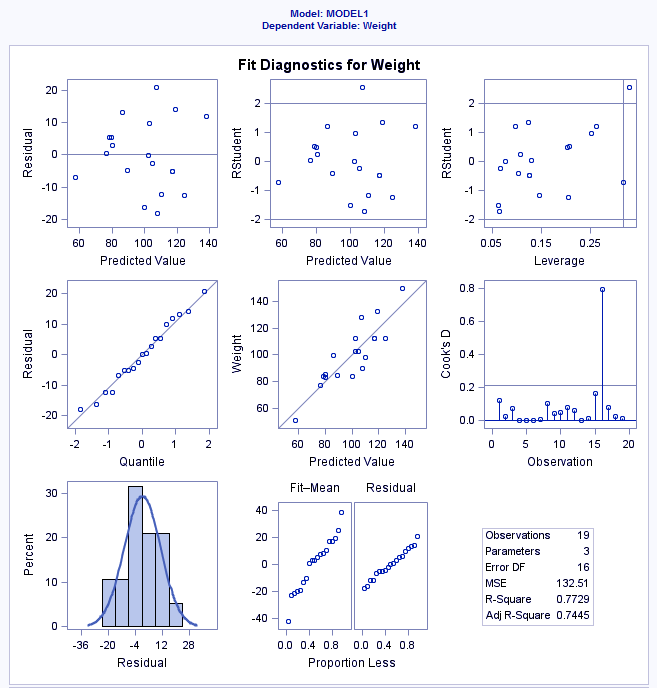
The above code also gives the graphical view of various estimates of the model as shown below.
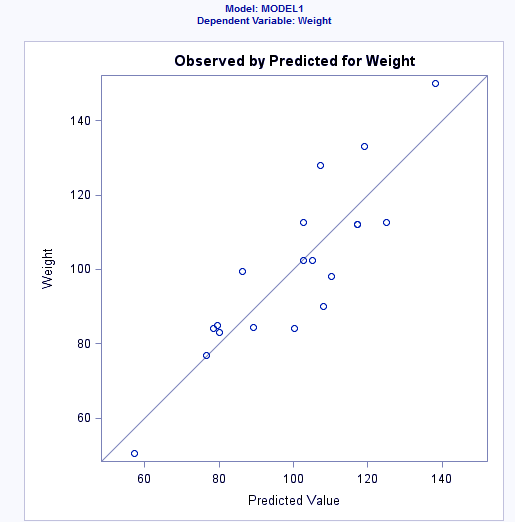
Linear Regression Between Two Variables – Graphical View
SAS Linear Matrix
This was all in SAS Linear Regression Tutorial. Hope you like our explanation.
Conclusion
Hence, we hope you all understood what is SAS linear regression, how can we create a linear regression model in SAS of two variables and present it in the form of a plot.
For any queries post your doubts in the comments section below and stay tuned to learn more interesting things in SAS Programming Language.
Did we exceed your expectations?
If Yes, share your valuable feedback on Google

