NumPy Statistical Functions with Examples
Free NumPy course with real-time projects Start Now!!
Statistics is concerned with collecting and then analyzing that data. It includes methods for collecting the samples, describing the data, and then concluding that data. NumPy is the fundamental package for scientific calculations and hence goes hand-in-hand for NumPy statistical Functions.
NumPy contains various statistical functions that are used to perform statistical data analysis. These statistical functions are useful when finding a maximum or minimum of elements. It is also used to find basic statistical concepts like standard deviation, variance, etc.
NumPy Statistical Functions
NumPy is equipped with the following statistical functions:
1. np.amin()- This function determines the minimum value of the element along a specified axis.
2. np.amax()- This function determines the maximum value of the element along a specified axis.
3. np.mean()- It determines the mean value of the data set.
4. np.median()- It determines the median value of the data set.
5. np.std()- It determines the standard deviation
6. np.var – It determines the variance.
7. np.ptp()- It returns a range of values along an axis.
8. np.average()- It determines the weighted average
9. np.percentile()- It determines the nth percentile of data along the specified axis.
Finding maximum and minimum of array in NumPy
NumPy np.amin()and np.amax()functions are useful to determine the minimum and maximum value of array elements along a specified axis.
import numpy as np
arr= np.array([[1,23,78],[98,60,75],[79,25,48]])
print(arr)
#Minimum Function
print(np.amin(arr))
#Maximum Function
print(np.amax(arr))
Output
[98 60 75]
[79 25 48]]
1
98
Finding Mean, Median, Standard Deviation and Variance in NumPy
Mean
Mean is the sum of the elements divided by its sum and given by the following formula:
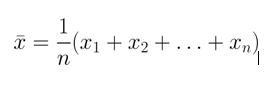
It calculates the mean by adding all the items of the arrays and then divides it by the number of elements. We can also mention the axis along which the mean can be calculated.
import numpy as np
a = np.array([5,6,7])
print(a)
print(np.mean(a))
Output
6.0
Median
Median is the middle element of the array. The formula differs for odd and even sets.
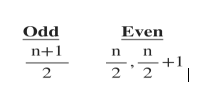
It can calculate the median for both one-dimensional and multi-dimensional arrays. Median separates the higher and lower range of data values.
import numpy as np
a = np.array([5,6,7])
print(a)
print(np.median(a))
Output
6.0
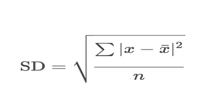
Standard Deviation
Standard deviation is the square root of the average of square deviations from mean. The formula for standard deviation is:
import numpy as np
a = np.array([5,6,7])
print(a)
print(np.std(a))
Output
0.816496580927726
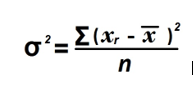
Variance
Variance is the average of the square deviations. Following is the formula for the same:
import numpy as np
a = np.array([5,6,7])
print(a)
print(np.var(a))
Output
0.6666666666666666
NumPy Average Function
NumPy np.average() function determines the weighted average along with the multi-dimensional arrays. The weighted average is calculated by multiplying the component by its weight, the weights are specified separately. If weights are not specified it produces the same output as mean.
import numpy as np
a = np.array([5,6,7])
print(a)
#without weight same as mean
print(np.average(a))
#with weight gives weighted average
wt = np.array([8,2,3])
print(np.average(a, weights=wt))
Output
6.0
5.615384615384615
NumPy Percentile Function
It has the following syntax:
numpy.percentile(input, q, axis)
The accepted parameters are:
- input: it is the input array.
- q: it is the percentile which it calculates of the array elements between 0-100.
- axis: it specifies the axis along which calculation is performed.
a = np.array([2,10,20])
print(a)
print(np.percentile(a,10,0))
Output
3.6
NumPy Peak-to-Peak Function
NumPy np.ptp() function is useful to determine the range of values along an axis.
a = np.array([[2,10,20],[6,10,60]])
print(np.ptp(a,0))
Output
Summary
These functions are useful for performing statistical calculations on the array elements. NumPy statistical functions further increase the scope of the use of the NumPy library. The objective of statistical functions is to eliminate the need to remember lengthy formulas. It makes processing more user-friendly.
You give me 15 seconds I promise you best tutorials
Please share your happy experience on Google

